


:quality(80))
:quality(80))
Read summarized version with
 ChatGPT
  Perplexity
  Gemini
  Claude
  Grok
Grok Key takeaways
Wisepops Experiments tracks the full customer journey from campaign display through to order, so you can optimize for revenue rather than clicks alone.
Control group testing measures whether a campaign generates incremental revenue versus doing nothing — not just which variant performs better.
Automatic conclusion rolls out the winning variant to 100% of traffic once 95% statistical significance is reached, with no manual action needed.
Every channel is testable: onsite campaigns, bars, embeds, and feed notifications all support split testing.
The revenue per visitor metric shows the commercial impact of a campaign across all exposed visitors — not just those who clicked — making it the most complete measure of whether a campaign is worth running.
Small wins compound. Better timing, a sharper offer, one less step in the opt-in flow — each test produces a new baseline that the next test builds on.
Some ecommerce teams run campaigns based on assumptions — a discount feels right, a layout looks good, a message seems clear. Wisepops Experiments is built to replace that with something testable.
This article covers what the Experiments feature does, how it measures results, and what real tests have produced. For a step-by-step setup guide, see how to A/B test campaigns in Wisepops.
In this article:
See which campaigns on your site are actually adding revenue
We analyze your traffic and show you where structured testing would have the highest impact on conversions.
:quality(80))
What Wisepops Experiments solves
Teams running multiple active campaigns and seeing steady traffic often start asking harder questions. Is the welcome offer actually converting new visitors, or would those visitors have bought anyway? Does a percentage discount outperform a fixed amount? Should the campaign fire on landing or after a delay?
Without a way to test properly, those questions get answered by gut feel or one-off observations that don't hold up. A campaign that looks strong on attributed revenue may be taking credit for purchases that would have happened regardless. A campaign that looks weak on click-through rate may actually be the one moving revenue.
The specific problems Experiments addresses:
Running split tests manually by swapping campaigns in and out, with no clean data separation between variants.
Optimizing for click-through rate, only to find that the CTR winner does not produce more orders.
No way to prove to a stakeholder whether a campaign is incremental or just capturing baseline behavior.
Having to rebuild the winning variant from scratch after a test concludes, losing historical continuity.
Experiments addresses all four. Setup is native to the campaign builder, every metric is visible in the results view regardless of which one you optimize for, and winners can be promoted to standalone campaigns without rebuilding.
How Wisepops Experiments works
An experiment runs from within the campaign dashboard. You start from an existing active campaign, create variants, set a traffic split and a success metric, then publish. Results are tracked automatically and you're notified when the test reaches a conclusion.
Traffic allocation
Traffic splits 50/50 by default. You can adjust this — for example 80/20 if you want limited exposure to an untested variant while still collecting data. Adding a control group takes this further: a share of visitors follows the same targeting rules as your campaign but sees nothing, establishing a clean baseline for measuring incremental impact.
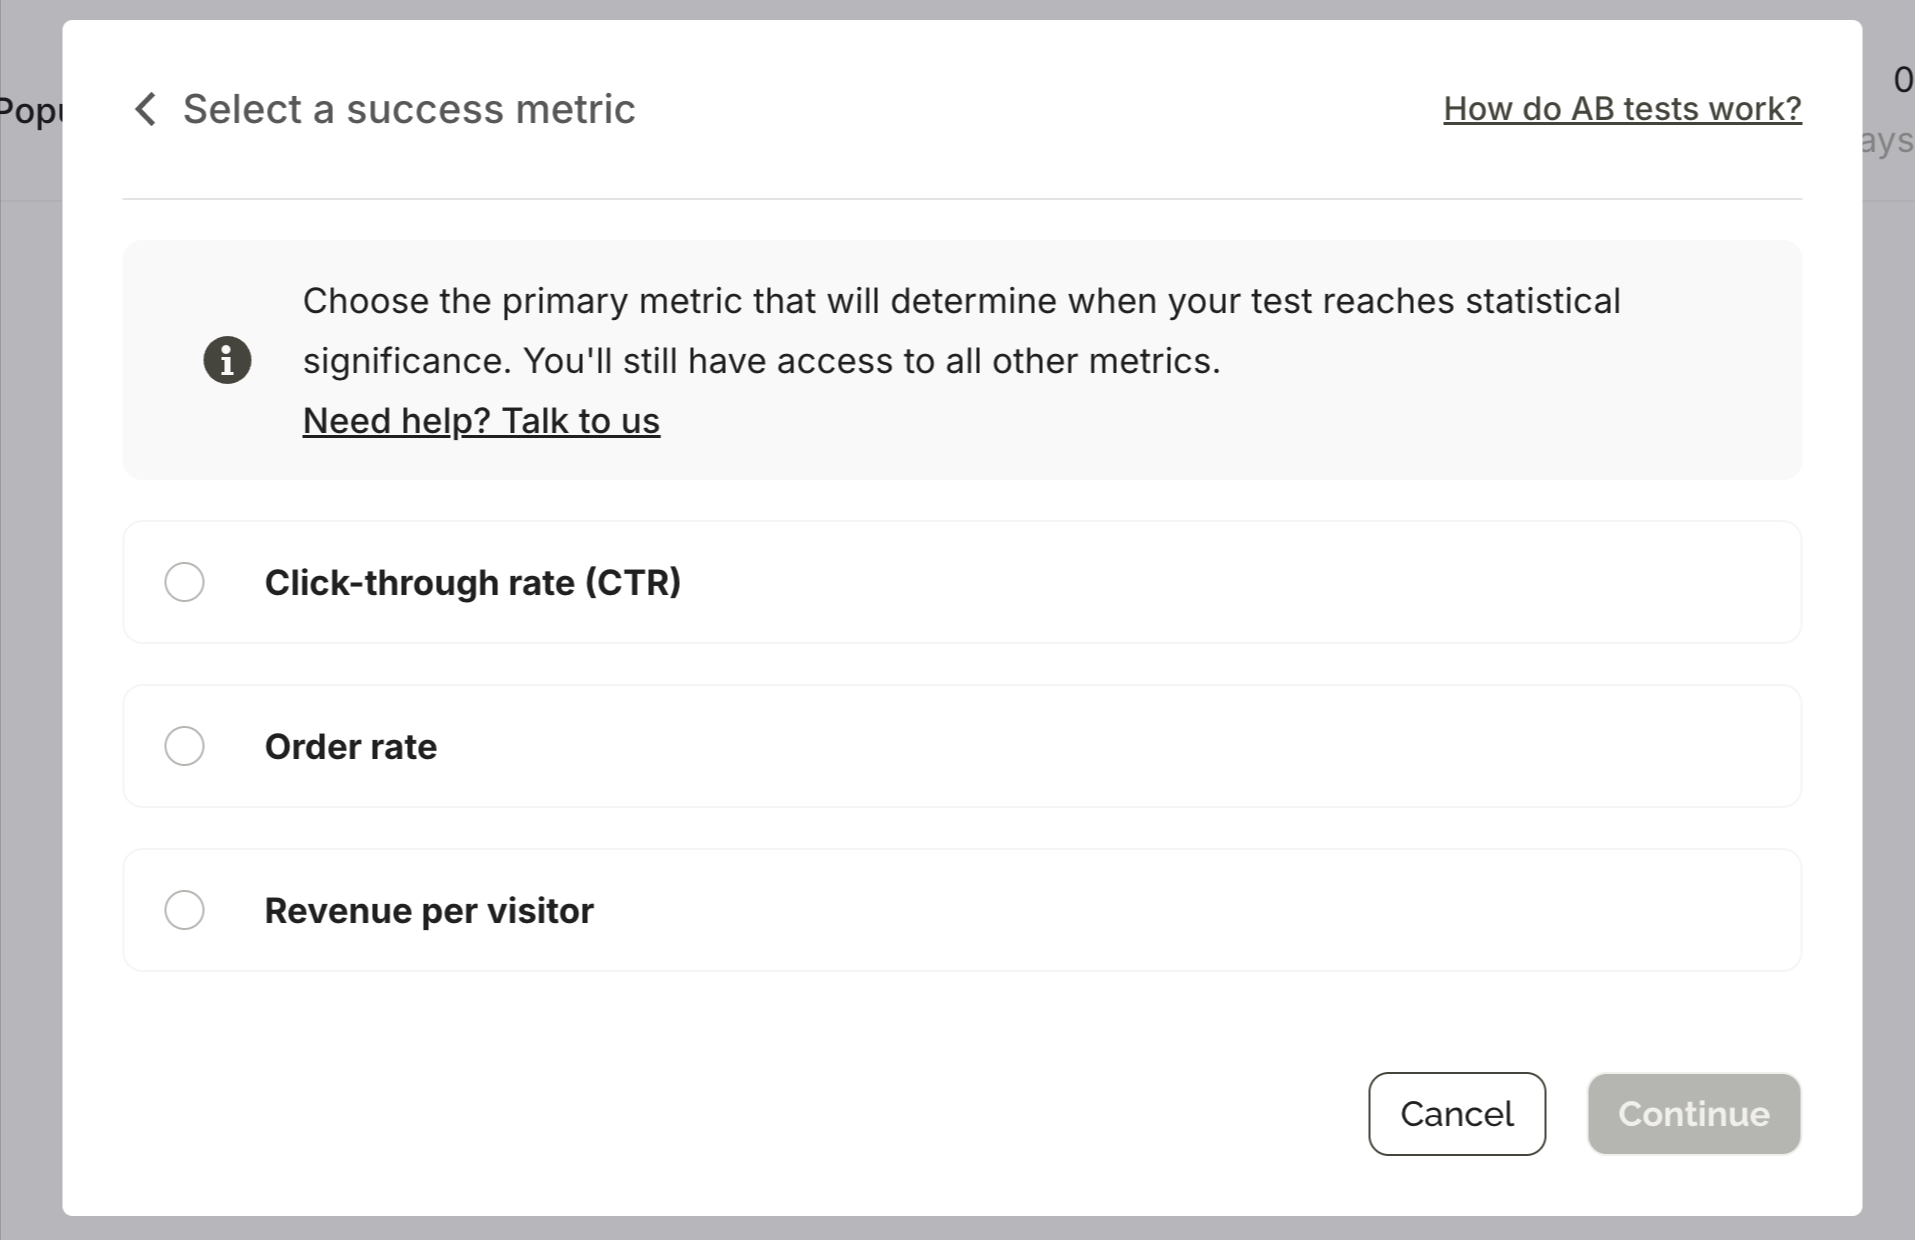
Success metric
You choose which metric determines when the experiment concludes: click-through rate, conversion rate, bounce rate, or campaign goal. The metric you pick does not limit what you see — all metrics are visible in the results regardless. This matters because the CTR winner and the revenue winner are often not the same variant.
Automatic or manual conclusion
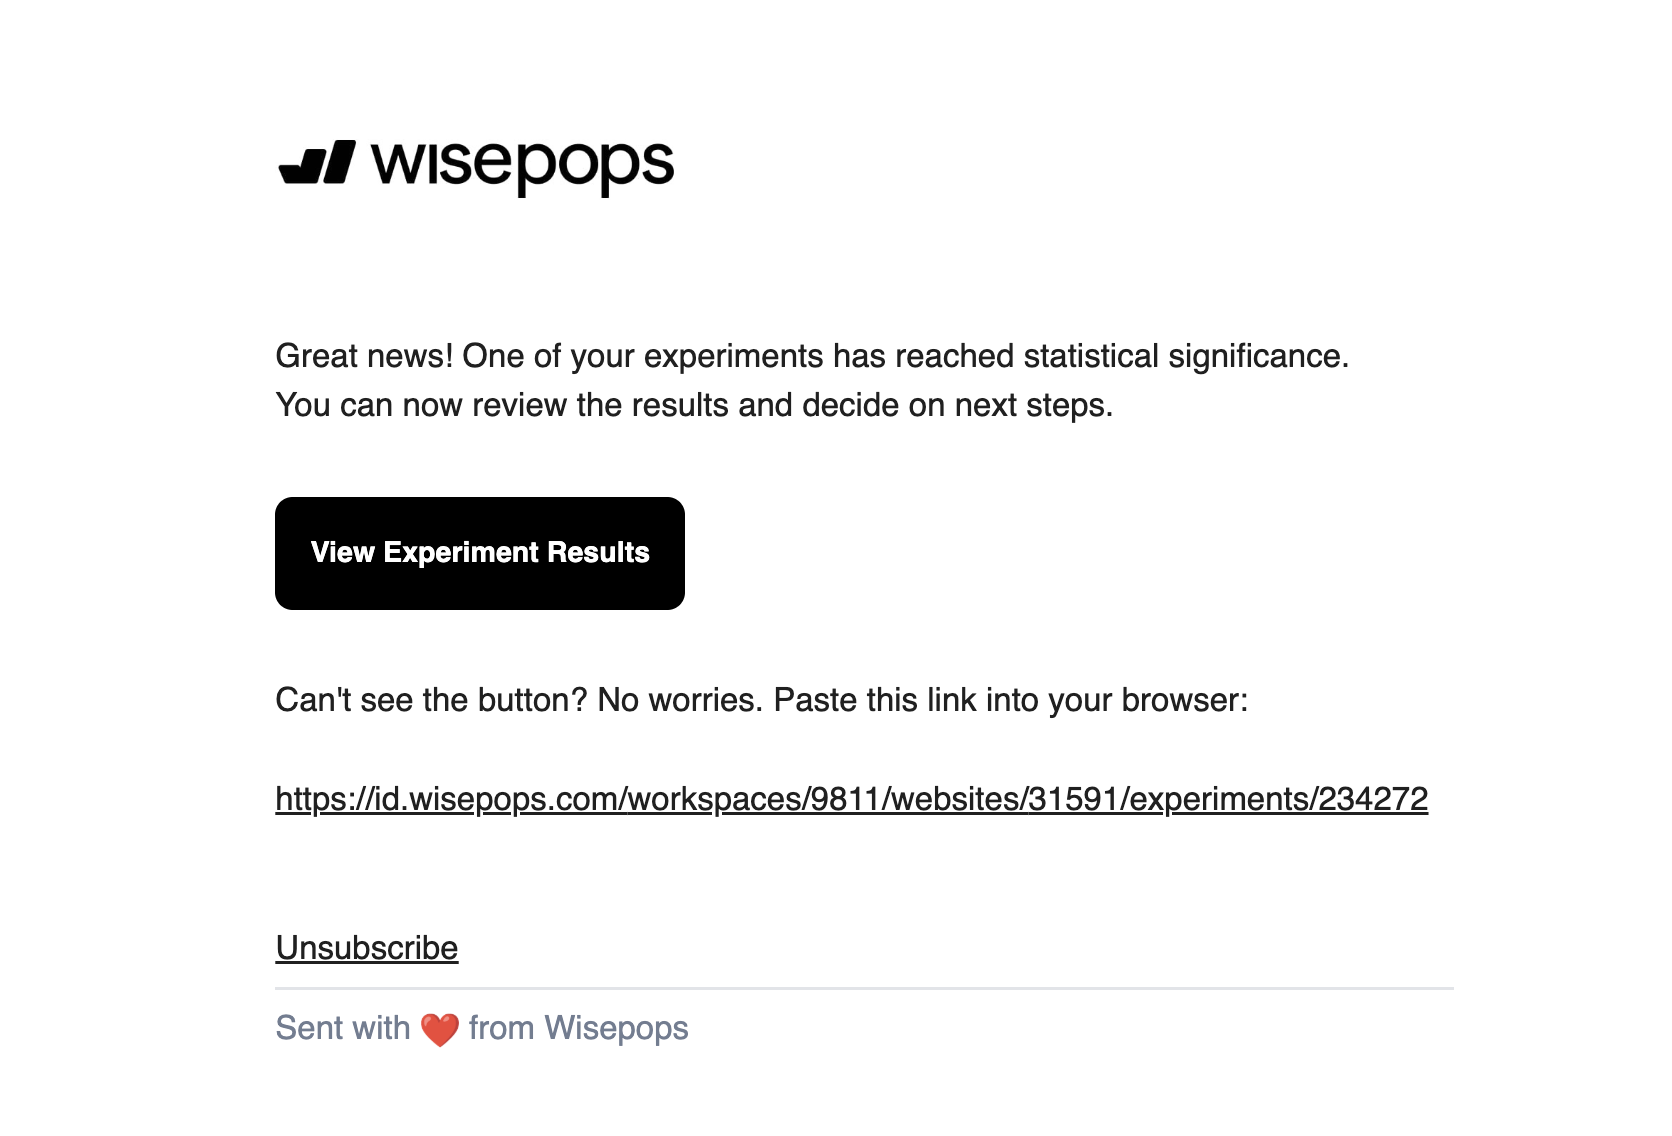
With automatic conclusion enabled, Wisepops rolls out the winning variant to 100% of traffic once one variant reaches 95% statistical confidence. You receive an email notification when significance is reached — no monitoring required.
You can also set a maximum end date so the test closes on a fixed timeline even if significance hasn't been reached. The best-performing variant at that point gets rolled out. For teams working within a seasonal calendar, this prevents tests from running across different promotional periods and contaminating results.
The Experiments dashboard
Accessible 24 hours after launch, the dashboard shows active and concluded experiments, statistical significance status, and a full breakdown of all metrics by variant. Results are exportable. For concluded tests, you duplicate the winning variant as a new standalone campaign, keeping the experiment's historical data separate.

On statistical significance: Wisepops calculates this automatically using Bayesian statistics. The test is conclusive when one variant reaches 95% confidence — you don't run the numbers manually. You can estimate how long a test will take to reach significance based on your traffic using the Wisepops A/B test calculator.
What you can test
Every major channel in Wisepops supports split testing. The most common test types and what each reveals:
What to test
Channel
What it reveals
Offer framing: percentage vs. fixed discount
Welcome campaign, cart recovery
Which framing drives higher sign-up rate and whether it holds on AOV
Campaign position: centered overlay vs. bottom slide-in
Any campaign
Whether visibility or intrusiveness has more impact on engagement
Trigger timing: on landing vs. after delay
Any campaign
Whether early or late exposure produces better conversion
Copy friction: with vs. without a dismissal option
Multi-step SMS capture
Whether removing an exit path increases or decreases completions
Campaign vs. control group (no campaign)
Any campaign
Whether the campaign generates incremental revenue above baseline behavior
Incentive type: discount vs. free gift
Welcome, cart abandonment
Which offer drives sign-up rate vs. which produces higher revenue per visitor
Feed notification: one-click vs. two-step
Feed campaigns
Whether reducing steps increases or decreases qualified click-throughs
One consistent pattern across experiments: the CTR winner and the revenue winner frequently diverge. A variant that gets more clicks does not always produce more orders or higher average order value. This is why reviewing multiple metrics before declaring a winner matters — and why setting a revenue goal, not just CTR, as your success metric often tells a more complete story.
What results look like and how to read them
The Experiments dashboard organizes results into four metric categories: Campaign (displays, clicks, CTR), Revenue (attributed conversion rate, average order value), Visitor (session depth, bounce rate), and Custom (any goal defined on the campaign). Each shows per-variant data side by side with percentage differences highlighted.
The OddBalls test below illustrates the multi-metric view: a centered full-screen overlay tested against a bottom slide-in across 44,400 visitors over 7 days.
Metric
Baseline A — bottom slide-in
Variant B — centered overlay
Result
Click-through rate
5.1%
6.0%
+17.2% uplift — winner
Email opt-ins
Baseline
+~18%
Strong evidence results are real
SMS sign-ups
Baseline
+~26%
Strong evidence results are real
Total visitors
22,200 (50%)
22,100 (50%)
Test ran 7 days
In this case, the CTR winner also happened to win on contact capture, making the decision straightforward. But when a CTR winner and a revenue winner diverge — which happens more often than expected — the decision depends on what you're actually optimizing for: list growth, immediate revenue, or average order value. Experiments shows all three simultaneously so the trade-off is explicit rather than assumed.
Control groups: measuring true revenue impact
Standard A/B testing answers one question: which version performs better? Control group testing answers a different one: does running a campaign at all actually add revenue?
The distinction matters more than it seems. A welcome campaign might show strong attributed conversion rate, while a segment of visitors who never saw it converts at nearly the same rate. The campaign would appear to be working, but most of those conversions would have happened regardless. Without a control group, you have no way to see this. It's one of the most common sources of overconfidence in onsite campaign performance.
In Wisepops, a control group follows exactly the same targeting rules as your campaign variants — same pages, same triggers, same audience conditions. The only difference is that this segment sees nothing. That makes the comparison valid. The revenue gap between the control group and your campaign variants is the actual incremental impact the campaign is producing.
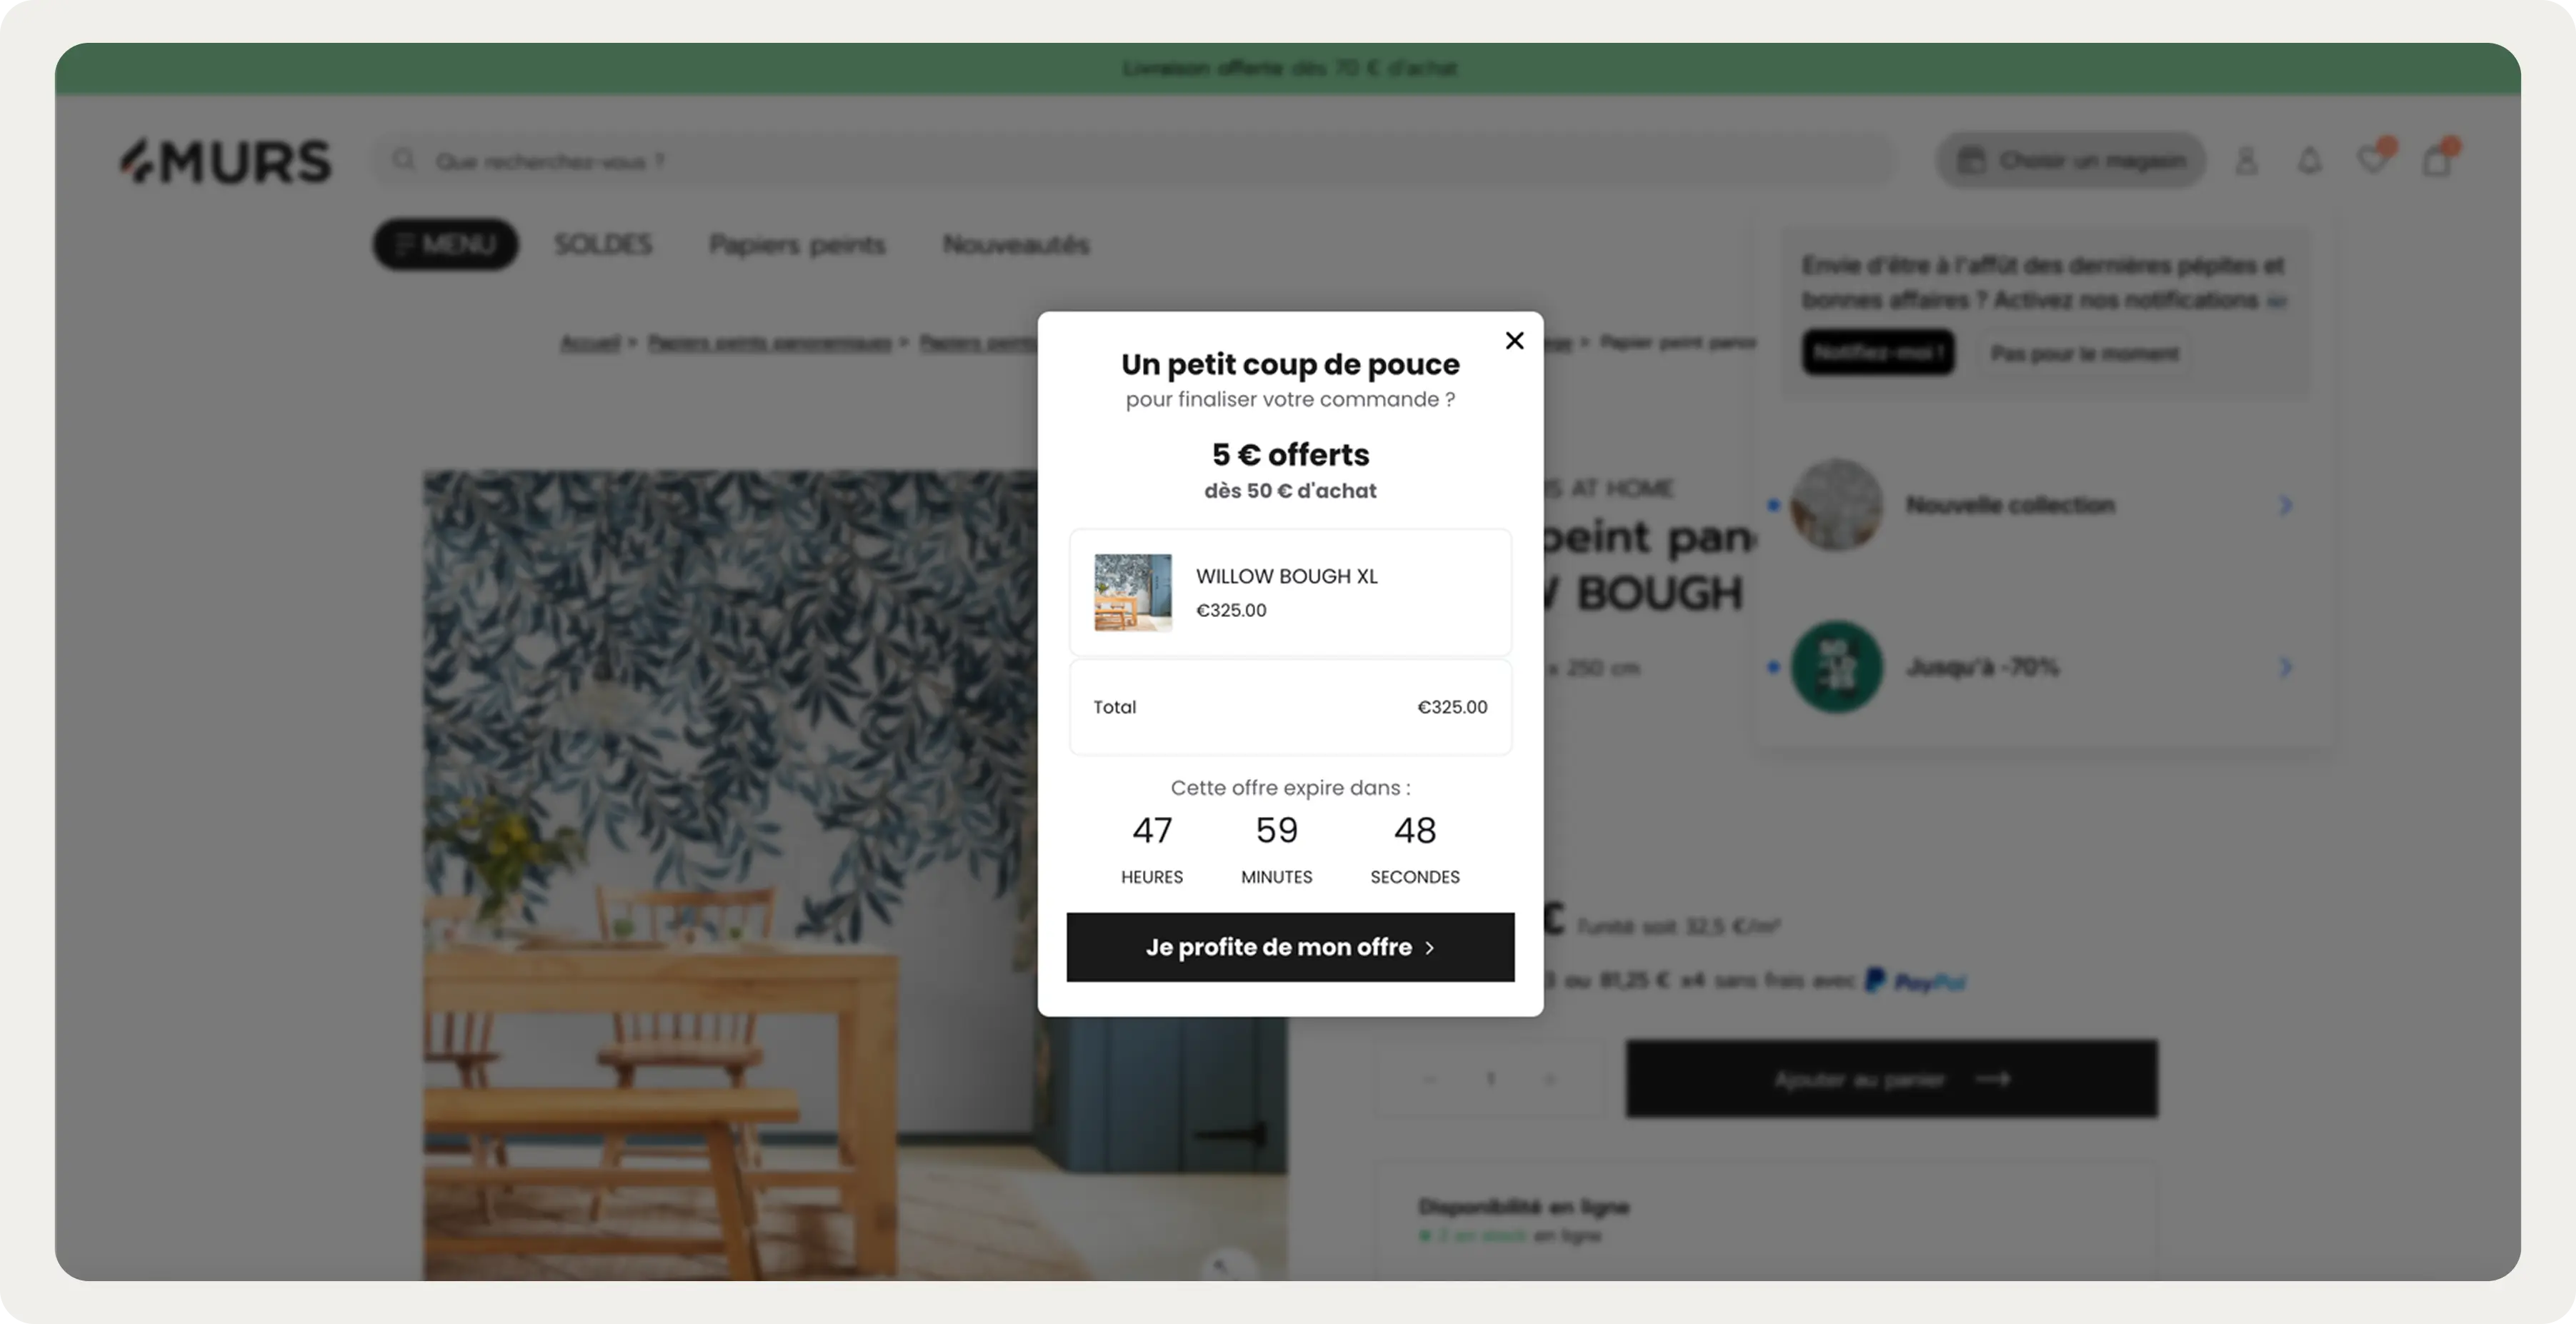
4murs, a French home decor brand, ran this test with their AI cart recovery campaign in January 2026. The campaign fired on exit-intent for sessions with items in the cart, pulling real-time cart contents and pairing them with a time-limited offer. Against a control group that saw nothing, the test variant recorded 24.5% CTR. The control group recorded zero.
Because the audience was entirely organic, there was no paid retargeting fallback — every recovered session was one that would otherwise have ended without a purchase. The control group made this provable rather than assumed.
How structured testing compounds over time: Emma Sleep
The most instructive examples of what testing produces come from teams that run experiments systematically rather than sporadically. Emma Sleep runs continuous test-and-learn cycles across their markets, with some campaigns accumulating 40 or more versions over their lifetime.
Two tests illustrate the pattern:
Test 1: fixed vs. percentage discount on exit-intent (89,000 impressions)
Variant A showed a fixed monetary discount. Variant B framed the same offer as a percentage. The percentage framing produced a +18% uplift in sign-up rate. Both variants ran to the same audience under the same conditions — the difference is attributable to framing alone.
Test 2: close CTA on SMS opt-in step (128,000 impressions)
After a visitor submits their email in a gamification campaign, the subsequent SMS opt-in step contained a small line of text offering a way to dismiss it. Removing that single line produced a +10% uplift in SMS sign-up rate across 128,000 impressions. The friction was invisible until it was measured.
:quality(80))
"We treat every campaign as a hypothesis. Wisepops makes it easy to run proper A/B tests with real volume and real results. A lot of the sign-up rate improvements we've seen over time come from small wins stacking up — and that only happens if you have the tooling to test systematically."
Emma Sleep marketing team
Emma also tested their cart abandonment intervention against a control group. The campaign — no discount, leading with trial reassurance and social proof — produced a 5.54 percentage point reduction in cart abandonment rate and a +5.5% increase in average order value across Email+SMS campaigns. The AOV lift is the notable data point: the message didn't just change whether visitors bought, it changed how much they spent.
How to get started
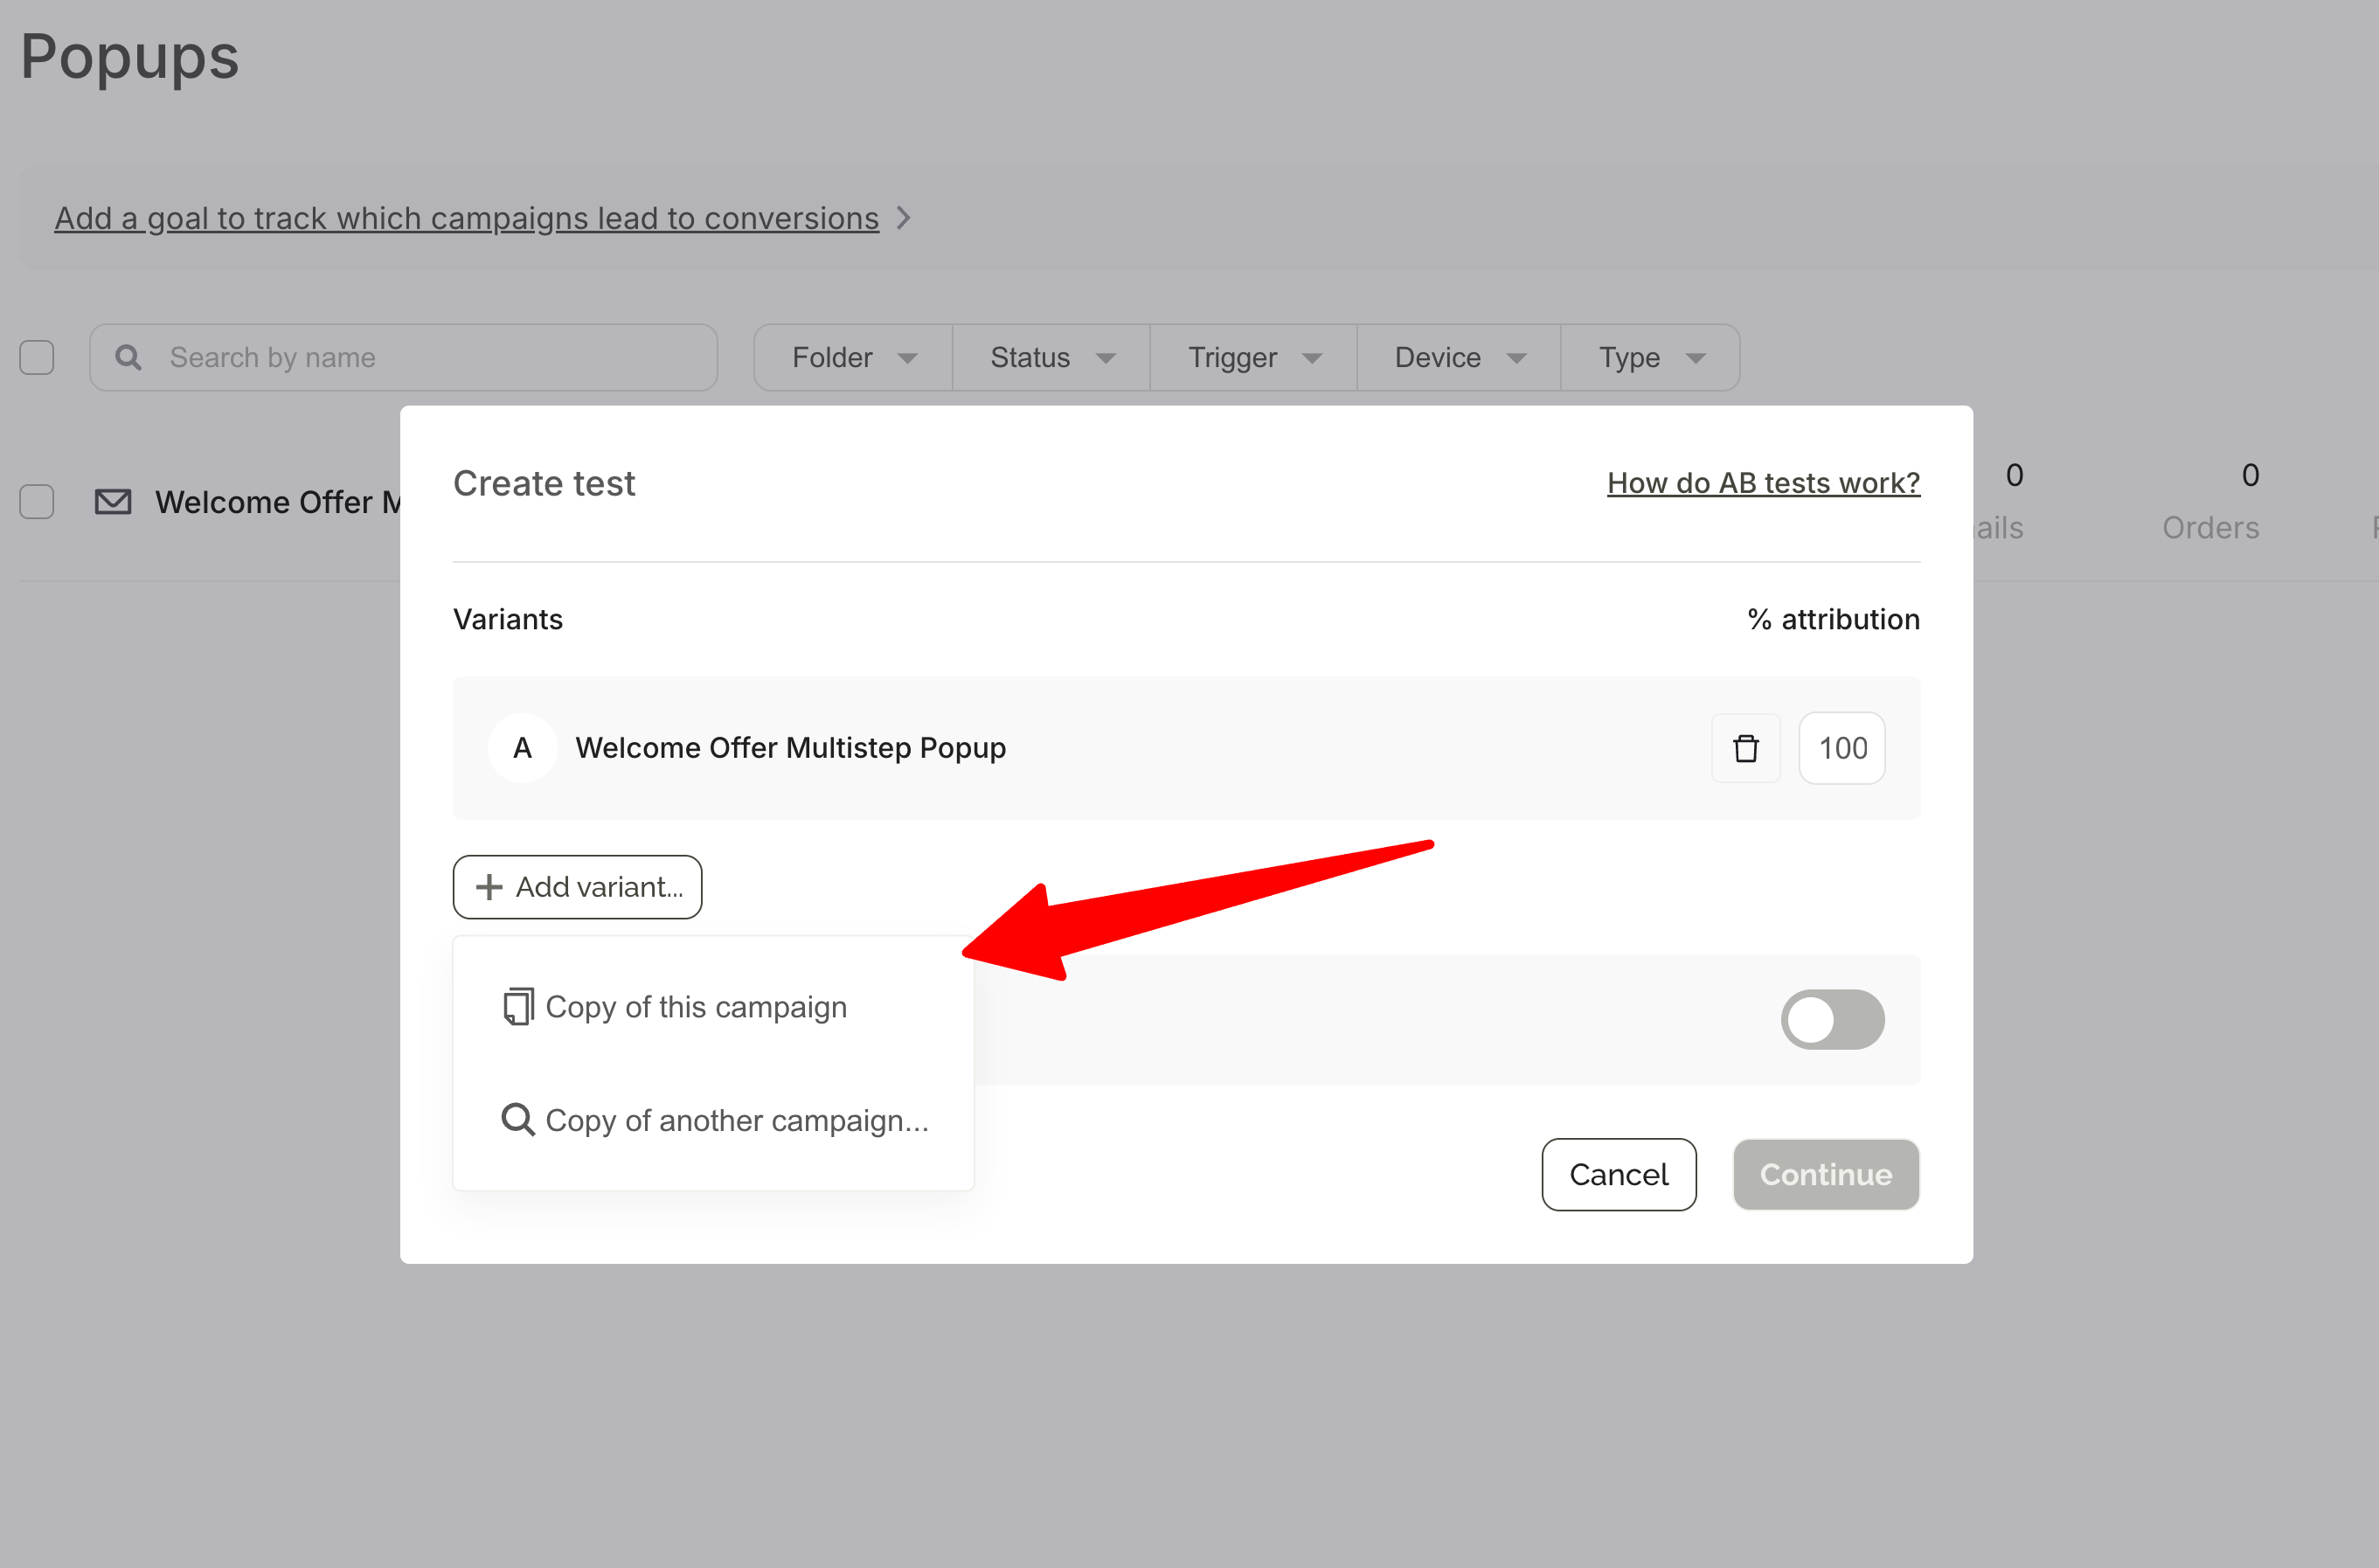
Experiments runs from within the campaign dashboard — hover over any active campaign and click the A/B test icon, or go to Experiments in the main menu. No separate tool to set up.
The core steps: choose a variant to test against your baseline, set a traffic split (50/50 by default), optionally add a control group, select a success metric, then configure how the test ends — automatic conclusion at 95% significance, or a fixed end date.
Once published, results appear in the Experiments dashboard 24 hours later. Wisepops notifies you automatically when significance is reached.
:quality(80))
For a full step-by-step walkthrough including hypothesis writing, what to test first, and how to read results:
Frequently asked questions
How long does a Wisepops experiment take?
There is no fixed timeline — significance depends on your traffic volume and how large the difference between variants is. You can set a maximum end date to close the test at a fixed point regardless of significance, which is useful when working within a promotional calendar.
What is a control group in a Wisepops experiment?
A control group is a share of your audience that follows the same targeting rules as your campaign variants but sees nothing. It establishes a revenue baseline so you can measure whether running a campaign at all produces incremental results — rather than just which version performs better. This is the difference between optimization and validation.
Can I test campaigns with different targeting settings?
Yes. You can test campaigns with different triggers, timing, or audience conditions. When you do, make sure you're analyzing metrics that account for the structural difference. If you're comparing an immediate trigger versus an 8-second delay, CTR will naturally favor the delayed version — total leads generated or conversion rate is a more meaningful comparison in that case.
What happens after a test concludes?
With automatic conclusion, Wisepops rolls the winning variant out to 100% of traffic. For manual conclusion, click "Duplicate as new campaign" on the winning variant. The new campaign replaces the test and tracks stats independently. The original experiment stops automatically, and historical data remains visible in the Experiments dashboard.
Can I test feed notifications and embeds?
Yes. Experiments supports all channels: onsite campaigns, bars, embeds, and feed notifications. The setup process is the same across formats.
How is attributed revenue calculated?
Wisepops uses a conservative attribution model: real order amounts within a 24-hour window from campaign interaction, tracked via a script on your order confirmation page. Results reflect actual transactions rather than platform-reported estimates. The Revenue tab in results also shows revenue per visitor across variants, so you can see whether one version influences how much visitors spend, not just whether they convert.
Where to start
The highest-leverage first experiment for most teams is their highest-reach campaign — usually a welcome or email capture campaign — tested against a control group. That single test tells you whether the campaign is producing incremental revenue. Everything after that builds on a baseline you can trust.
From there, the pattern that compounds is the same one Emma runs: one variable at a time, at meaningful impression volume, with results feeding the next iteration. Small wins accumulate into a measurably better setup over time.
If you want to understand where testing would have the most impact on your specific traffic, the Wisepops demo starts with a traffic audit that identifies which campaigns and segments to prioritize first.
Get started
in minutes
Start converting more visitors today.
Get started in minutes and see results right after.