












Read summarized version with
 ChatGPT
 Perplexity
 Gemini
 Claude
 Grok
Key takeaways
Definition: A/B testing is one of the main ways to improve how a website performs. Two versions run at the same time, and the traffic decides which one wins.
Results: across 5,710 experiments, winners beat the version they replaced by a median of 58%. Over half improved the result by at least 50%.
Tools: testing tools split traffic between versions for you, a sample size calculator works out the traffic you need, and a significance calculator checks the result.
Process: the same eight steps every time. Choose what to improve, set your metric, write a hypothesis, build both versions, size the test, run it, read the results, and send all traffic to the winner.
Learning: every test teaches you something. The ones that win get shipped, and the ones that lose tell you what to stop doing across the rest of the site.
A/B testing is one of the most effective ways to increase conversions on a website, be it newsletter subscriptions, sales, average order value, or software signups. That's why A/B testing is a crucial element of CRO strategies.
In this guide, you'll learn how to get started with A/B testing for increased conversions and run your CRO experiments the right way from the very first test.
In this article:
See your segments
Match each visitor to the right campaign
We review your traffic and show which behavioral segments you have, the campaigns that fit each one, and the revenue they could reach.


More on conversion optimization:
For online store owners: Guide to ecommerce CRO
For improving lead gen: How to automate lead generation
What is A/B testing in CRO?
A/B testing, also called split testing, is the most common form of CRO testing. Two versions of a page or onsite campaign run at the same time, with traffic split between them, to measure which one converts better.
Version A is what is live now. Version B is the change you believe will perform better. The visitors who reach each version show you which one wins.
Three things to know before you start:
A/B testing covers more than one type of experiment. Comparing two versions of a page is the basic form. You can also run more than two variants (A/B/n), test several elements at once (multivariate), or let the test push more traffic to whichever version is winning while it runs (multi-armed bandit).
All A/B experiments compare the same metrics: conversion rate, click-through rate, bounce rate, orders, or leads collected.
You can run your first test quickly. Modern CRO tools let you run experiments as soon as you build your first campaigns. Our popup builder, for example, splits traffic automatically between two or more versions of a campaign.
How to run A/B tests on Shopify: create a test in minutes with a step-by-step guide.
What every CRO test needs
Whichever type of test you run, the setup is the same. Five things have to be in place before you launch, and a test missing any one of them will produce a result you cannot trust or act on.
Every test needs:
A hypothesis. A statement predicting which version will win and why, based on customer data, visitor research or a known best practice.
One outcome to measure. Email signups, revenue, click-through rate, conversion rate. Decide it before you launch, and track it in your analytics.
A control and at least one variant. The control is what is live now, and the variant carries the change. Nothing else between them should differ.
Enough traffic to reach statistical significance. Check how many visitors you need with a sample size calculator, then confirm the result with an A/B test calculator.
An even, random traffic split. Each version gets the same share of visitors, assigned at random. Anything else biases the result.
Benefits of A/B testing for CRO, based on 2026 benchmarks
Our Onsite A/B Testing Benchmarks 2026 covers 5,710 experiments run between January 2024 and June 2026.
Here is what A/B testing for CRO returns, according to that data:
Benefit
What it means
What the data shows
Higher conversions
A winning version replaces a weaker one, and the gap is rarely marginal
Winners beat the version they replaced by a median of 58% on the metric being tested. Over half improve it by at least 50%, and 37% more than double it
Better ROI
Every extra conversion comes from traffic you already paid for
Click-through gains a median of 63% when a test wins, revenue 52%, conversion 24%
Fast answers
A decision about a page or campaign takes days, not quarters
A third of tests reach a verdict within a week, half within two weeks
Customer insights
You find out what visitors actually respond to
A guaranteed discount repeatedly beat a spin-the-wheel, and a popup triggered after three pageviews beat one on a fixed five-second timer
Better user experience
The changes that win are the ones that ask less of the visitor
Image-led creative beats text-only, and a long form broken into steps beats the same form asked all at once
The gains CRO testing brings show up in different places depending on the business: more orders, a higher average order value, more leads and opt-ins, or a lower customer acquisition cost.
To see which of these gains are available on your own site, we run a free Traffic Activation Audit. You add one snippet, and after 7 to 10 days you get the behavioral segments already in your traffic, the size of the opportunity in each one, and the campaigns worth running for them.
Key areas to test for boosting conversions
You can test nearly anything on a website. These are the areas where businesses concentrate:
Area
What to test
CTA buttons
Wording, placement, color, size
Headlines and copy
Length, phrasing, how the offer is worded
Signup and lead forms
Number of fields, incentive, one step or several
Website popups
Incentive, size, placement on screen
Triggers and timing
Immediate display, time delay, scroll depth, pageview count, exit intent
Unique selling point
Value proposition, tone, length
Landing page design
Layout, copy, where the CTA sits
Website menus
Placement, links included, labeling
Checkout
Number of steps, payment methods, upsell offers
These areas cover the entire onsite customer journey, so you can also test less obvious elements, such as campaign timing, the emotional tone of marketing messages, gamification tactics, multi-offer strategies, and entry vs exit offers.
See examples of effective CRO campaigns and strategies:
Real examples of A/B testing
Emma Sleep: a percentage discount beat a fixed one
Emma Sleep sells in more than 20 markets and runs email and SMS capture across all of them, so small differences matter at scale. On an exit-intent popup, they tested a fixed discount against a percentage discount across 89,000 impressions.
The percentage version won, 2.59% sign-up rate against 2.20%, an 18% increase. The offer was worth roughly the same either way, so the difference came down to how it was written.
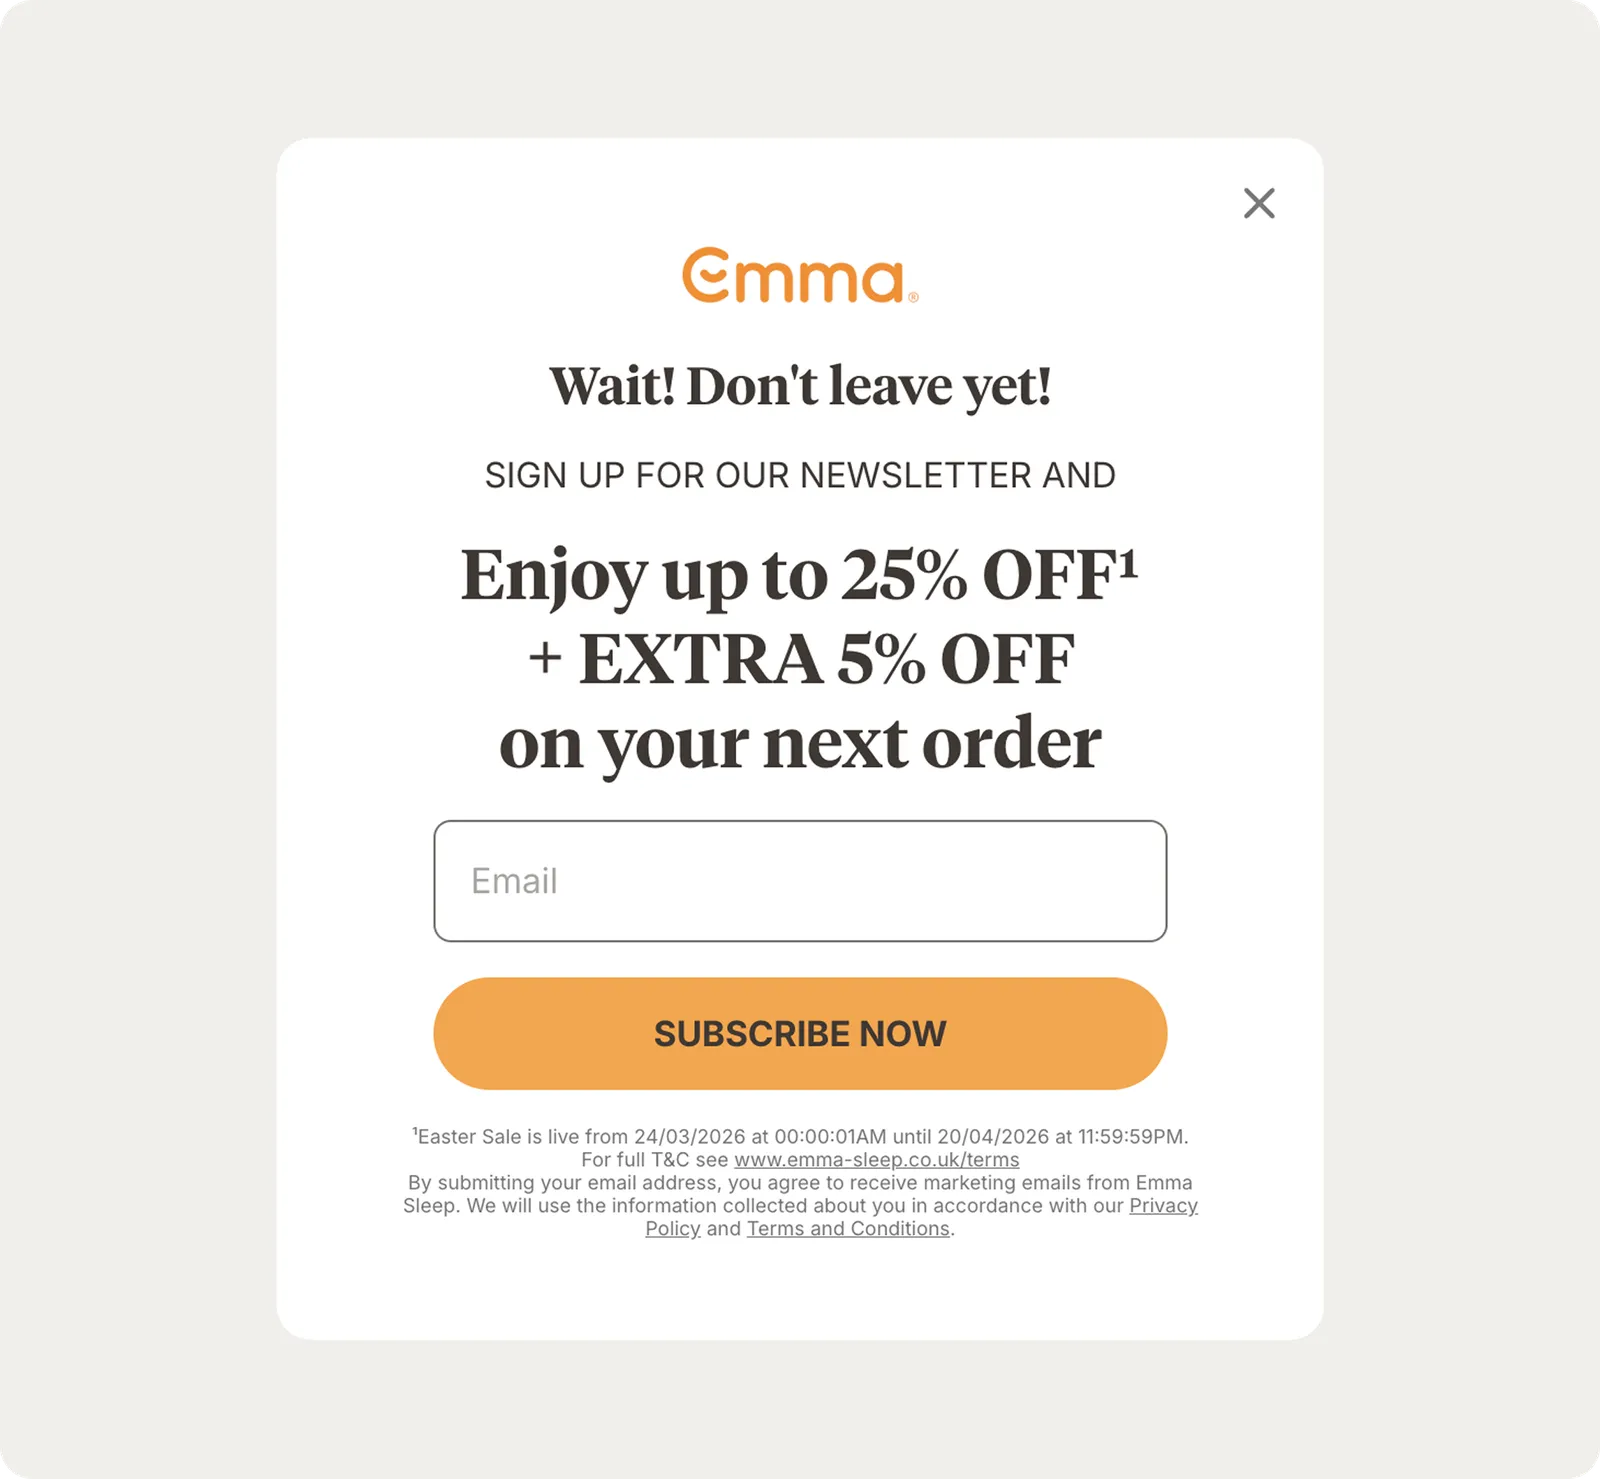
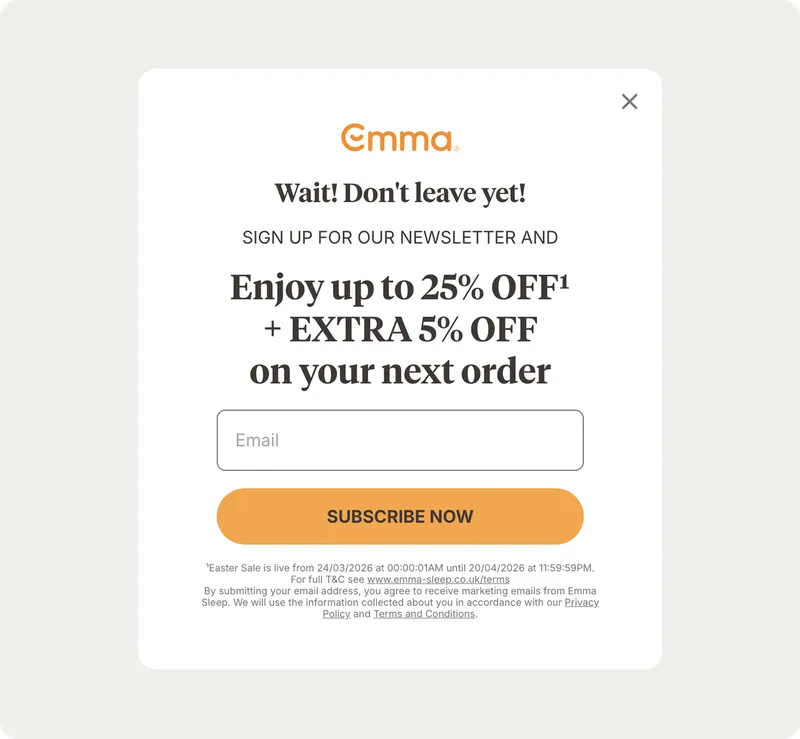
Emma Sleep’s exit-intent test: the fixed discount converted 2.20% of visitors, the percentage discount 2.59%.
Ideal of Sweden: a guaranteed discount beat a prize draw
On their Swedish store, Ideal of Sweden tested two welcome offers. One gave 15% off the first order. The other entered you into a draw to win a 1,000kr gift card. Same popup, same image, same form, only the headline and the offer changed.
The discount won, signing up 3.13% of visitors against 1.07% for the prize draw. The gift card is worth more, but only if you win it, and most people will not. The discount applies to everyone who signs up.
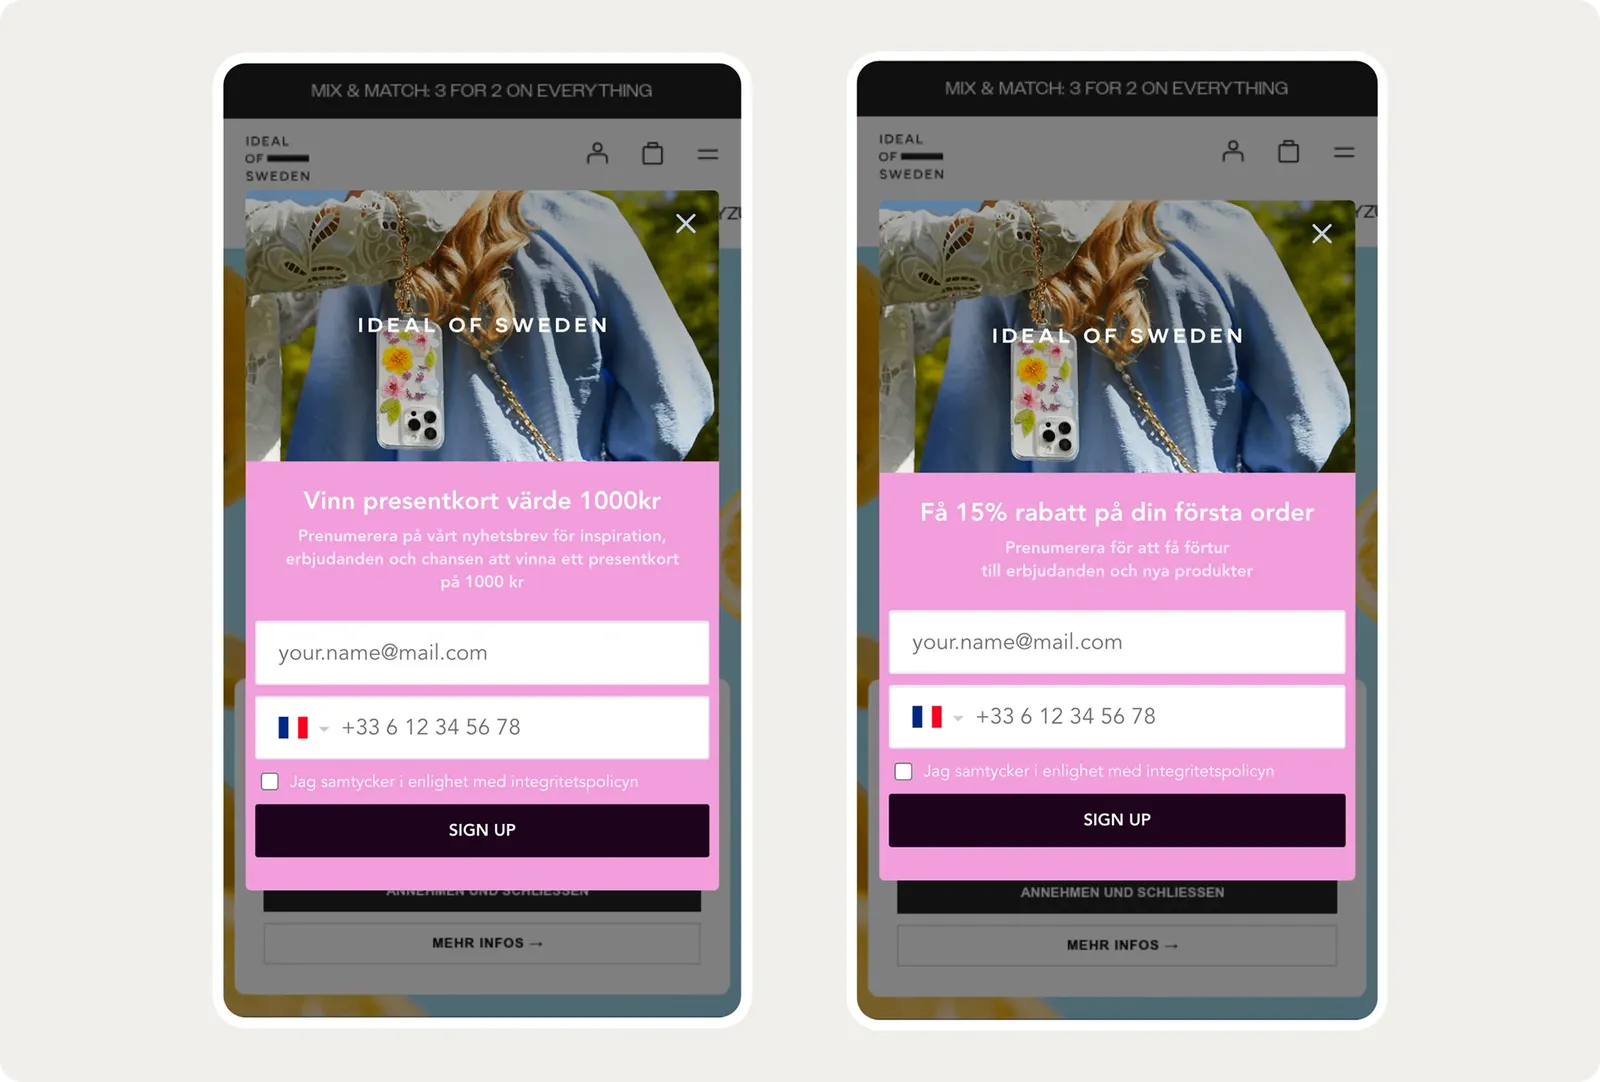
Ideal of Sweden’s two welcome offers: 15% off the first order won with 3.13% against 1.07% for the prize draw.
Bardot: a bolder mobile layout nearly doubled click-through
Bardot gets the majority of its traffic on mobile, so they built their membership signup campaigns for phones from scratch instead of shrinking the desktop version. During Black Friday, their busiest week of the year, they tested two of those layouts against each other.
The bolder layout with tighter copy took 15.7% click-through against 9.0%. They have run 19 tests on membership, seasonal and exit-intent campaigns, and their best mobile campaign sits at 26% click-through, around six times the industry average.
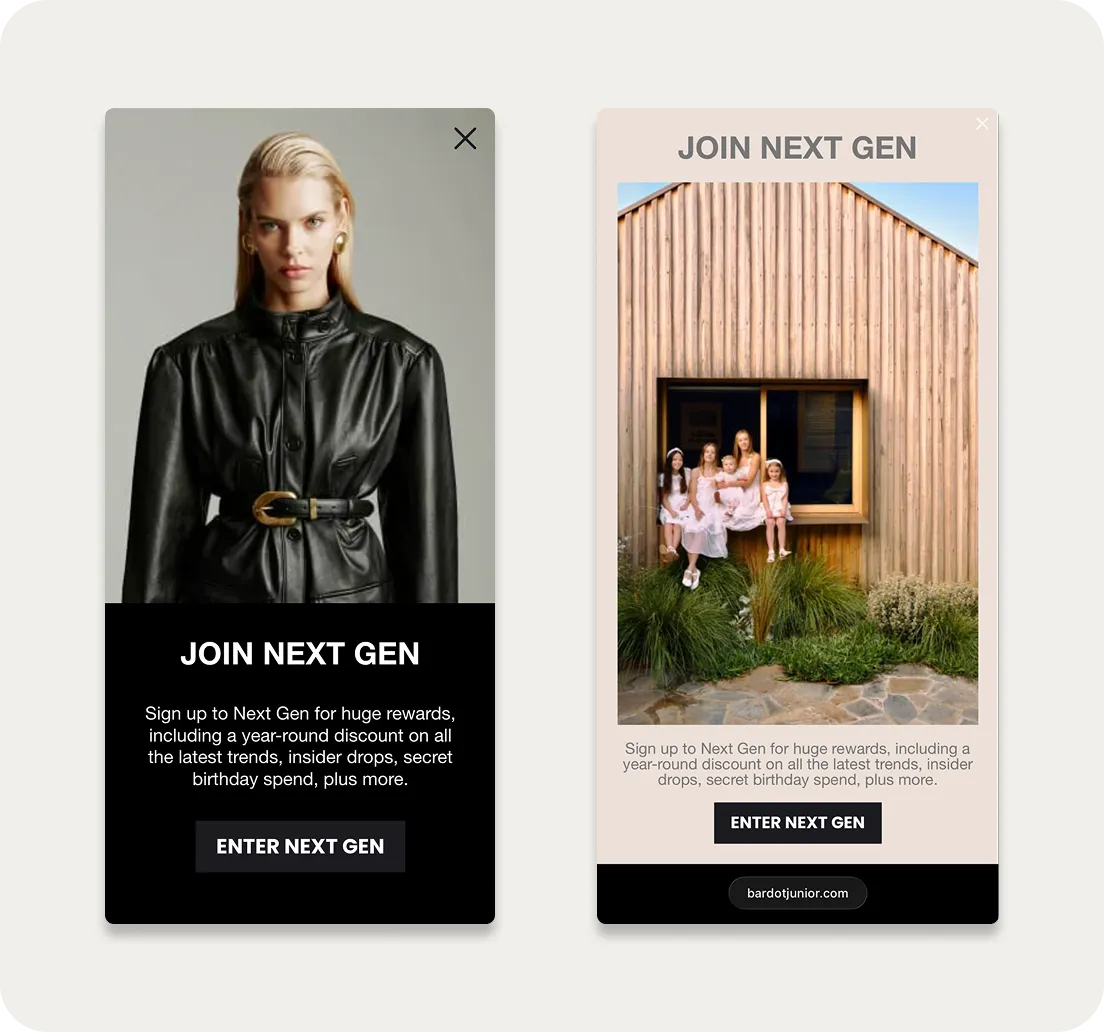
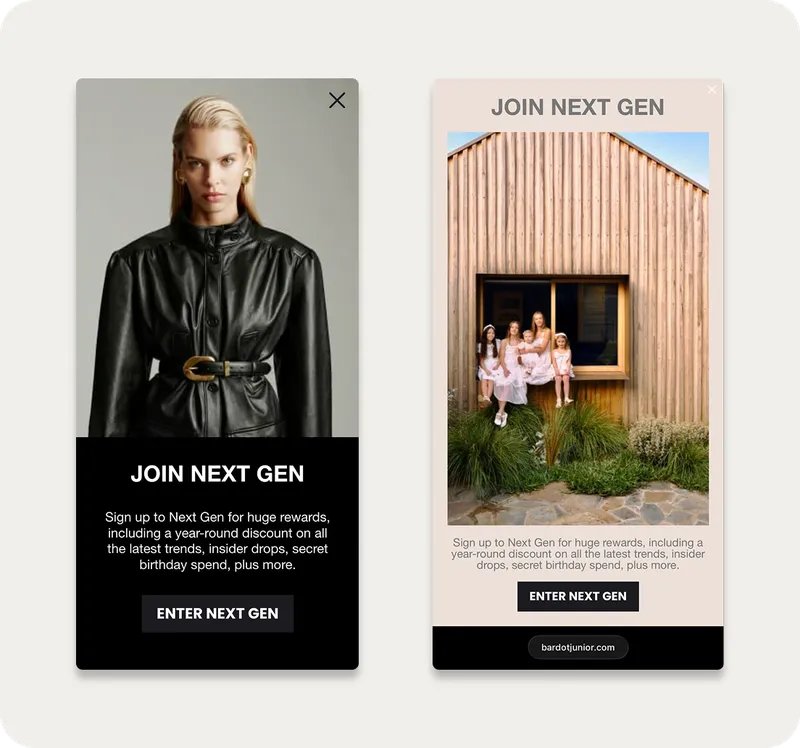
Bardot’s two mobile layouts: the bolder one took 15.7% click-through against 9.0%.
Madura: 350,000 impressions per version to find a small gain
Madura collects emails and phone numbers across several markets. They tested two versions of their new-visitor email popup at around 350,000 impressions each.
Sign-up rate went from 3.7% to 4.3%, an 18% improvement. A gap that small only shows up at that volume, which is why they test at it. As their team puts it, the improvements are “not one big change, they are a lot of small wins stacking up.”
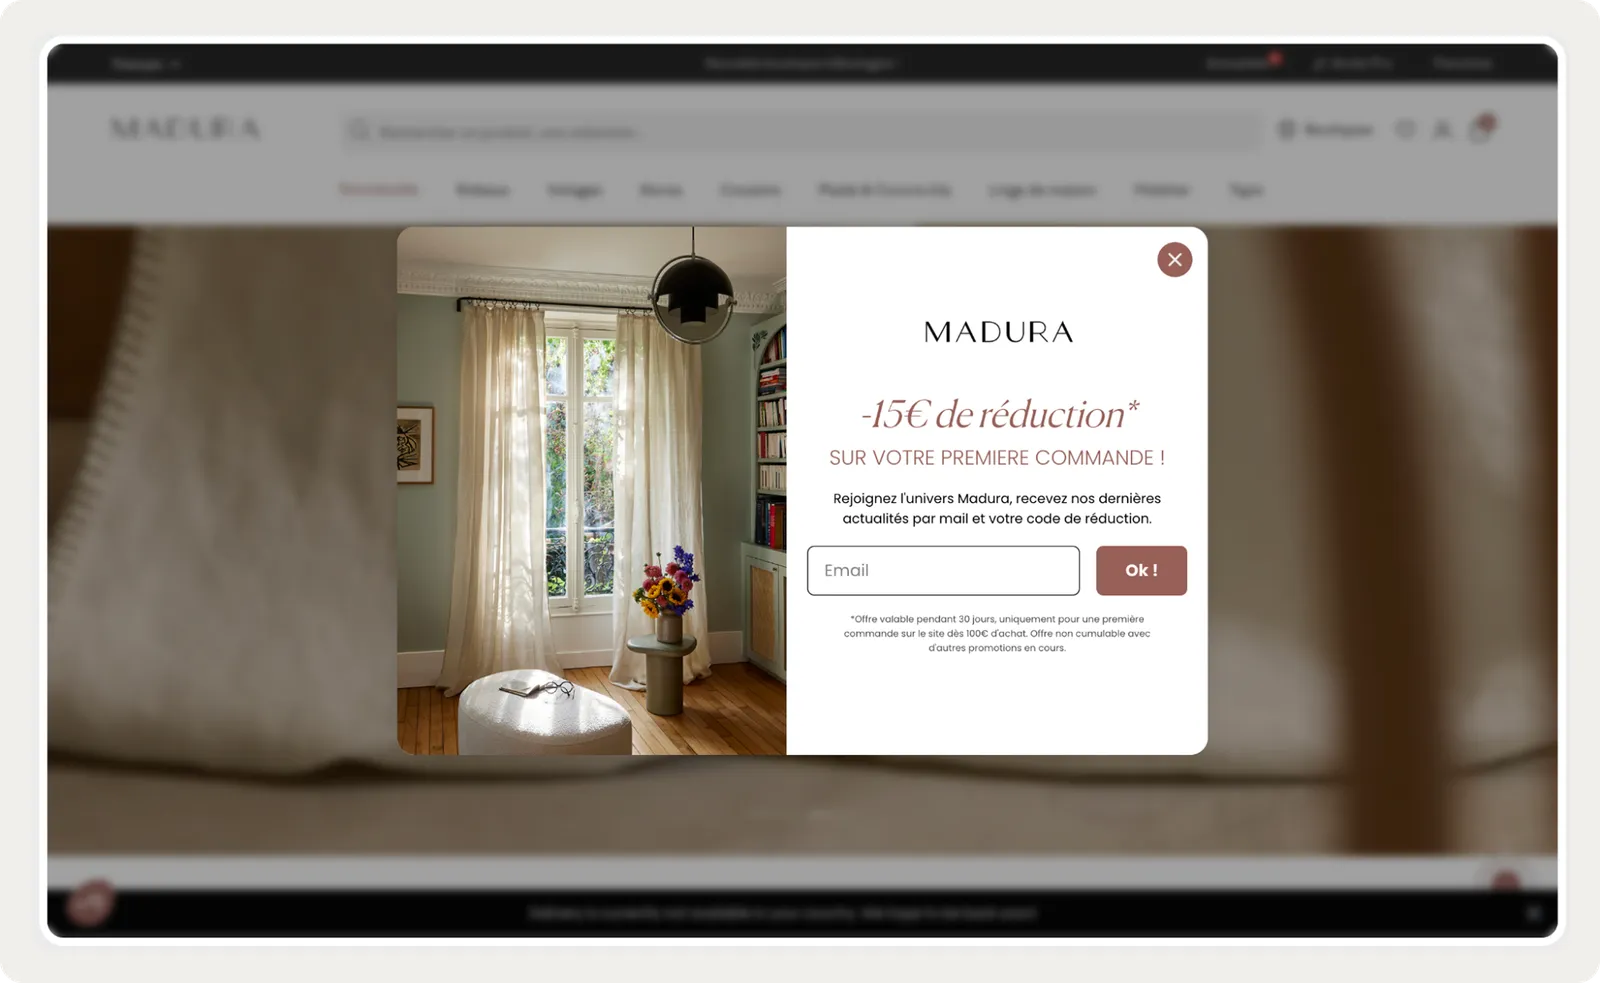
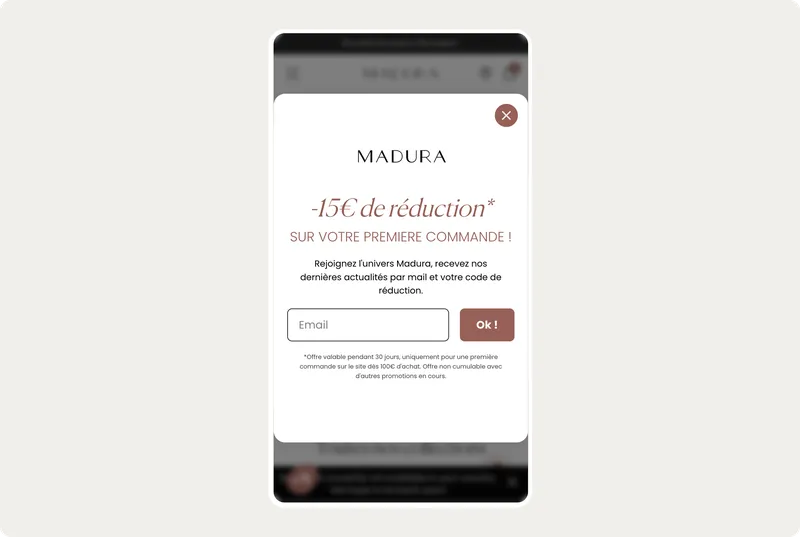
Madura’s new-visitor email popup, tested at around 350,000 impressions per version.
PMI: three designs against a group that saw nothing
PMI runs certification programs, and a lot of candidates start an application without finishing it. They built a popup to bring those people back, then tested whether it was worth running at all: 25% of visitors were held back and saw nothing, while the rest saw one of three designs. The test ran 13 days across 6,600 visitors.
All three designs beat the group who saw nothing, raising order rate by around 16%. Average order value stayed flat across all four groups, so the gain came from more people finishing their application.


PMI’s campaign for candidates who started an application without finishing it.
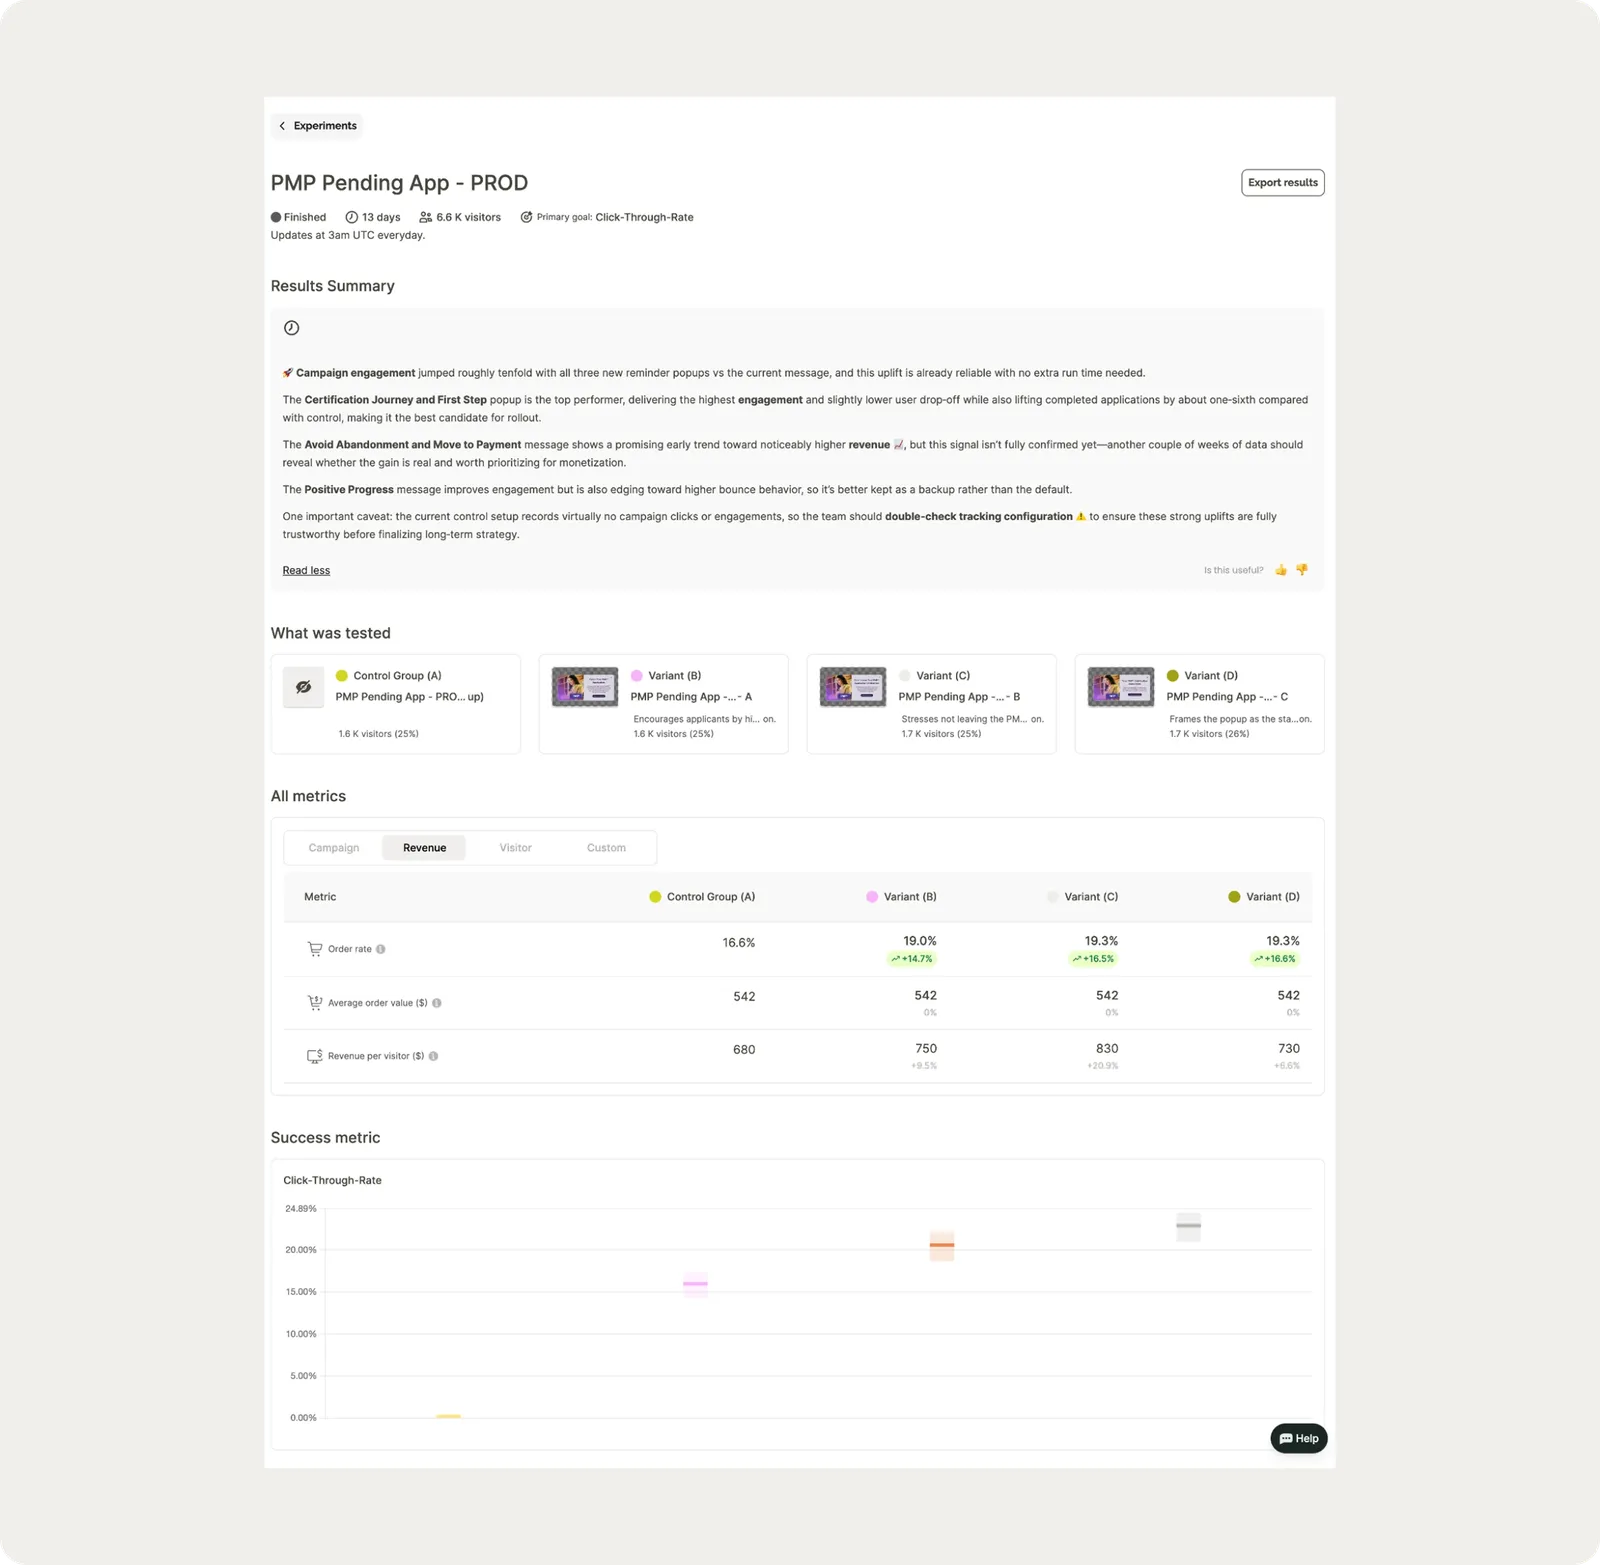
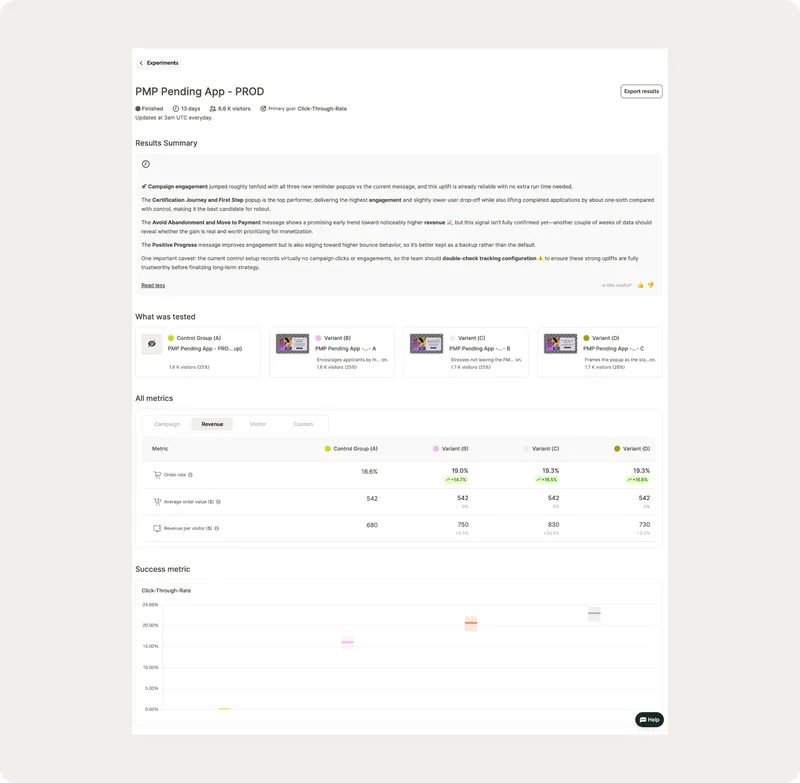
All three designs beat the control group, which saw no popup.
Nutrimuscle: splitting one ask into three steps
Nutrimuscle sells sports nutrition, and 85% of their traffic is on mobile, where long forms do badly. They ran a three-way test on their welcome popup, changing the design, the trigger, the offer and which data they asked for.
The winner splits the ask across three steps: email first, then phone number, sport and training frequency, then the discount code with product recommendations. That is the version running now. Across all their campaigns, Nutrimuscle collects over 7,000 emails and 5,000 phone numbers a year at a 4.1% sign-up rate.
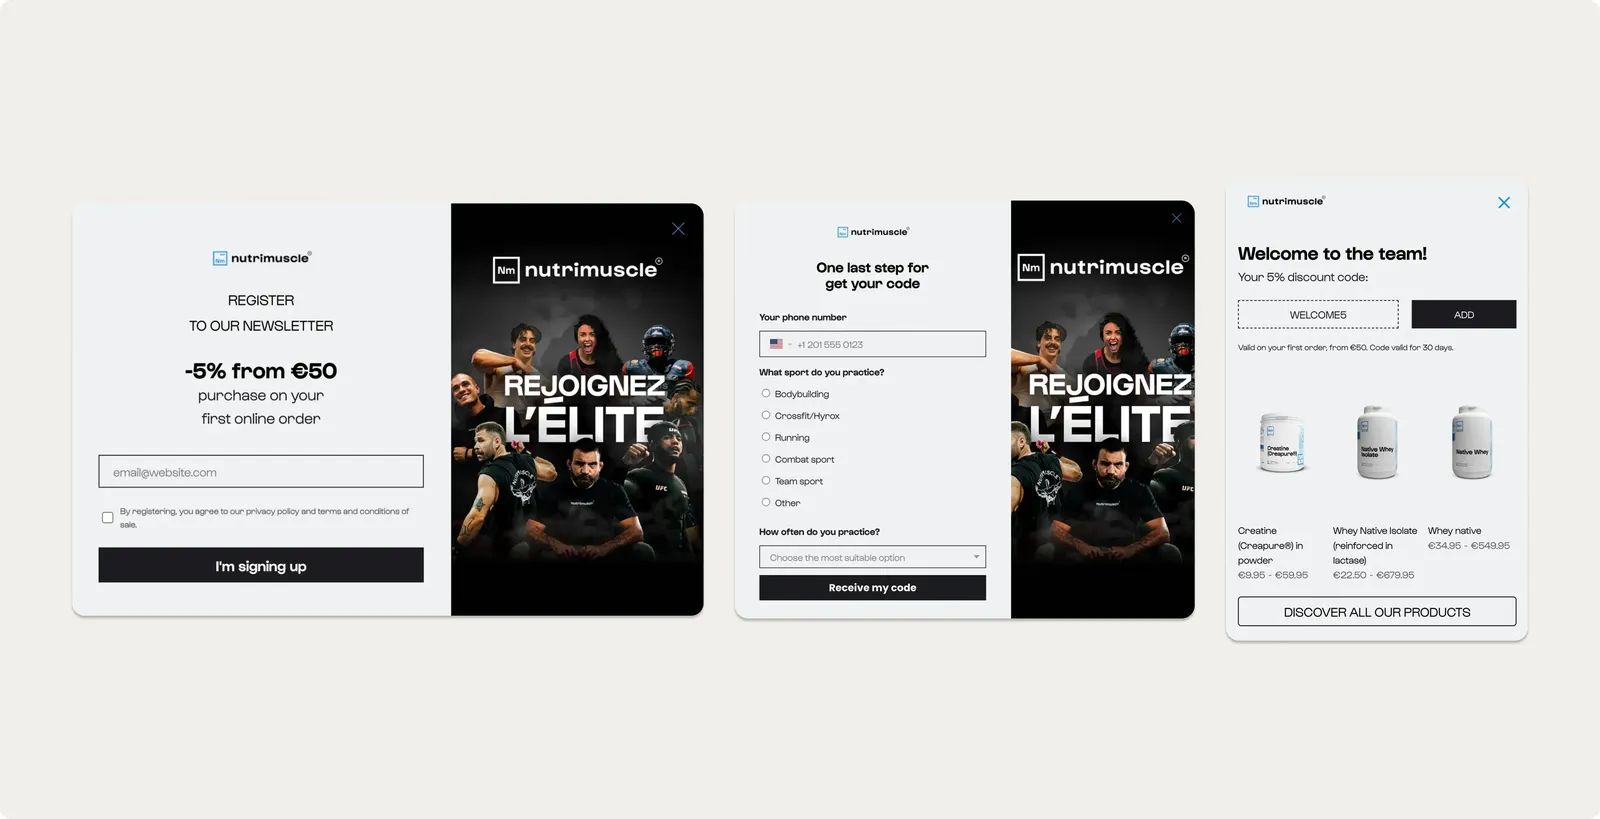
Nutrimuscle’s winning version: the email, then the phone number and two profile questions, then the code with product recommendations.
Types of CRO testing
A/B (split) testing
Takes one thing on your site, a landing page, a popup, a headline, a button, and compares the version running now against a version with a single change. This is the simplest type and the one that needs the least traffic, which is why 83% of experiments in our A/B testing benchmarks are a straight two-version A/B.
A/B/n testing
Same idea, but the version running now is compared against three or more alternatives instead of one, so you test several ideas in a single run. Each version needs its own share of traffic, so the more variations you add, the longer the test takes to reach a verdict.
A/B testing against a control group
Compares one or more versions of a campaign against a held-back slice of visitors who see no campaign at all. This is the only type that tells you whether running the campaign is worth it, instead of which version of it is better.
Multivariate testing
Changes several elements on the same page at once, such as a headline, an image and a button, and measures how the combinations perform against each other. Every element you add multiplies the number of combinations, so this type needs far more traffic than any other and only works on high-traffic pages.
Multi-armed bandit testing
Runs the same versions as an A/B test, but shifts traffic towards whichever one is winning while the test is still running, so less traffic goes to the version that loses. This type needs more traffic than a standard A/B test before it can start adjusting reliably.
How to set up an A/B test for CRO
Testing tools make A/B testing for CRO easy to set up, but the process behind it is worth reviewing step by step:
Choose what to improve
Set your goal and your metric
Write the hypothesis
Build version A and version B
Work out how long to run it
Run the test
Read the results
Ship the winner and plan the next one
Step 1: Choose an area for improvement
Start with the pages and campaigns that are already losing you conversions:
Pages with high bounce rates
Signup forms converting below what the rest of your site manages
Checkout pages with high abandonment
If you are not sure where to start, our free Traffic Activation Audit finds it for you. One snippet, 7 to 10 days, and you get the behavioral segments in your traffic, the size of the opportunity in each one, and the campaigns worth testing for them.
More options:
Step 2: Set your goal and your metric
Pick the one number you are optimizing before anything else. That number decides what counts as a win. Set that metric as the goal in your testing tool.
Step 3: Write the hypothesis
A hypothesis states what you are changing, what you expect it to do, and why. One simple paragraph covers all three:
“If we switch our newsletter campaign to an exit-intent popup with a discount and a countdown timer (the change), signups will rise by 10% (the expected impact), because the timer and the discount create urgency (the reasoning).”
Two more examples:
“If we reduce our newsletter form from four fields to two, lead generation will rise by 10%, because there is less to fill in.”
“If we change the homepage CTA from ‘Book a demo’ to ‘Request a free personalized demo’, demo signups will rise by 20%, because it reads as less of a commitment.”
Step 4: Build version A and version B
Version A is the control, the version now live. Version B carries the change. In most tools this means duplicating A and editing the one thing you are testing.
Change one element at a time. If you are testing the text on your homepage CTA, change the text and leave the color, the size and the placement alone. Anything else you move at the same time makes the result impossible to attribute.
Two settings to check before you launch:
Who sees it. New or returning visitors, desktop or mobile, which pages.
How traffic splits. Tools divide it evenly by default, which is what you want. An uneven split makes the result harder to trust.
Stick to two versions for your first tests. 83% of experiments in the benchmarks are a straight A against B, because every extra version takes a share of your traffic, so the test takes longer to reach an answer.
Step 5: Work out how long to run it
There is no fixed number of visitors a test needs. The number depends on two things: your current conversion rate, and how much better you expect the new version to be.
The free sample size calculator gives you the number. Enter your current conversion rate, the increase you expect, how many versions you are running and your daily traffic, and it returns visitors per variant, visitors in total, and how many days that takes at your volume.
A site converting at 4% with 1,000 visitors a day needs 17,940 visitors per version to detect a 15% increase, which takes 36 days.
Step 6: Run the test
Run it to the sample size you worked out in step 5, and avoid reading anything into the numbers before you get there. Reading results early is the most common way random variation gets mistaken for a winner.
Whatever that number says, let the test run at least one full week, so it covers every day of the week instead of a few weekdays.
Two things to watch while it runs. Be ready to pause if a variant slows the page or damages the experience. And avoid running across seasonal periods such as holidays, when behavior changes for reasons unrelated to your test.
Step 7: Read the results
Once you hit your sample size, check the result once with the free A/B test significance calculator. Enter the visitors and conversions for each version, and the calculator tells you whether the difference is real.
Take this example: 17,940 visitors per version, A converted 718 and B converted 825. That is 4.00% against 4.60%, a 14.9% increase, and the calculator confirms it is significant at 95% confidence.
The calculator reports four things:
The verdict. Whether the difference is real or could be chance.
The increase. How much better the winning version did.
The likely range. The real increase is somewhere between 4.4% and 25.4%. Plan on the low end instead of the 14.9% you measured.
Observed power. How good a chance the test had of spotting a difference this size. If a test comes back with no winner and low power, it ran on too few visitors to tell you anything.
Check the result once enough data has come in. Avoid stopping a test because a version looks like it is winning, because you could be looking at a false positive.
Expect one of three outcomes:
A clear winner. B beat A by a real margin.
The live version held. Your change did not beat what was already running. You now know to skip that change elsewhere on the site.
Inconclusive. The data could not separate the two, usually because of too little traffic or too small a difference. Run it longer if you can, or come back with a bigger change to test.
Whatever the outcome, look at the secondary metrics too, such as bounce rate, time on page and leads collected, and work out why the winner won.
Step 8: Send all traffic to the winner, then plan the next test
If you have a clear winner, end the traffic split and send everyone to the version that won. Keep an eye on it for a few weeks to check the gain holds outside the test.
Then keep going, because the gains come from tests stacking up over time.
Madura’s winning email campaign moved sign-ups from 3.7% to 4.3%, and their own summary of the program is that the improvements are “not one big change, they are a lot of small wins stacking up.” Emma Sleep has campaigns that have accumulated more than 40 versions over their lifetime.
What if CRO testing didn’t work?
Find out if the test had enough traffic or conversions to be statistically significant. If it did, consider experimenting with other sections of your website, or look into other ways to increase your conversion rate.
For example, you may consider spending more on ads, improving your website design or user experience, or even increasing your prices.
Get started
in minutes
Start converting more visitors today.
Get started in minutes and see results right after.