










Conversion rate optimization (CRO): steps and best practices

Read summarized version with
 ChatGPT
 Perplexity
 Gemini
 Claude
 Grok
Key takeaways
Definition: conversion rate optimization (CRO) is the systematic process of increasing the percentage of website visitors who complete a desired action. That action can be a macro conversion, such as a purchase or a booked demo. It can also be a micro conversion on the way there, such as an add to cart or a newsletter signup.
How to calculate it: conversion rate = (conversions / total visitors) x 100, measured separately for each goal. For example, 50 purchases from 1,000 visitors is a 5% conversion rate. The global ecommerce average is about 2%, but rates vary by country, industry and price, so your own past rate is the fairer benchmark.
Benefits: CRO increases revenue from existing traffic without extra ad spend, which lowers customer acquisition costs and improves marketing ROI. It also shows where visitors leave the funnel and why, and it complements SEO: search brings visitors in, and CRO helps them convert.
Core strategies: write action-oriented calls-to-action, remove friction such as forced account creation or late shipping costs, and add social proof like reviews and testimonials. Then time onsite campaigns to visitor behavior, personalize recommendations and offers, retarget visitors who leave, and confirm each change with an A/B test.
Types of CRO tools: web analytics tools such as GA4 measure conversions and drop-off. Heatmaps and session recordings show how visitors behave, and A/B testing tools compare page versions. Landing page builders, traffic activation platforms and email automation tools then act on what that research finds.
Examples: a product quiz that guides undecided visitors to the right product, a countdown timer that adds urgency to a discount, guest checkout for first-time buyers, and delivery costs shown on the product page instead of at the final checkout step.
Paid traffic keeps getting more expensive, and for many online stores it brings in a large part of every visit. When only a small share of those visitors buy, each sale has to carry more of that cost.
Analytics can show where visitors leave the site, though they rarely explain the reason. Returning customers also make up only a small part of the audience, so the visitors worth understanding are often first-time and anonymous.
Conversion rate optimization (CRO) helps by turning more of the traffic you already have into leads and customers. This guide explains how to calculate your conversion rate, what current benchmarks look like, a step-by-step process from research to A/B testing, and the tools that support each step.
In this article:
See your segments
Match each visitor to the right campaign
We review your traffic and show which behavioral segments you have, the campaigns that fit each one, and the revenue they could reach.


What is conversion rate optimization (CRO)?
Conversion rate optimization (CRO) is the systematic process of increasing the percentage of website visitors who complete a desired action. That action might be a purchase, a newsletter signup, a booked demo or a free trial, depending on what the site is built to do.
In digital marketing, website conversion rate optimization works on the traffic you already have. Instead of buying more visits, you study how current visitors behave, find the points where they hesitate or leave, and change those parts of the site.
Those changes can involve page structure and messaging, forms and checkout steps, calls-to-action, social proof, offers and onsite campaigns. Each one is tested against the current version, so you keep only the changes that improve the conversion rate.
Many of those changes answer objections. Visitors weigh doubts about shipping, returns, sizing or price while they browse, much as a buyer would raise them on a sales call, and a page that answers them early loses fewer people.
A conversion is whatever action you define as the desired outcome. It looks different depending on what your business is trying to achieve:
Type of conversion
What it looks like
Sales conversion
A visitor completes a purchase
Lead conversion
A visitor submits a contact form
Booking conversion
A visitor books a consultation or requests a call
Subscription conversion
A visitor signs up for your newsletter
Account conversion
A visitor creates an account or starts a free trial
Customer conversion
A trial user moves to a paid subscription
Benefits of conversion rate optimization
Better conversion rates translate into:
Increased revenue: Higher conversion rates directly translate into more sales and revenue for your business, without the need to increase website traffic or marketing spend.
Enhanced user experience: An optimized ecommerce website offers a smoother, more intuitive experience for users, making it easier for them to find what they need and complete desired actions.
Lower cost per sale: Conversion rate decides how much traffic each sale costs. At $1 per paid click, a sale costs $100 in traffic at a 1% conversion rate and $50 at 2%.
Room to scale paid channels: When each click converts more often, you can bid more for traffic and stay profitable, which opens up campaigns that would lose money at a lower rate.
Improved return on investment (ROI): By maximizing the value of your existing traffic, CRO helps you get more out of your marketing efforts, leading to a better ROI.
Gain customer insights: even when visitors leave without converting, CRO platforms deployed on your website or ecommerce learn from each interaction, especially with the development of AI personalization.
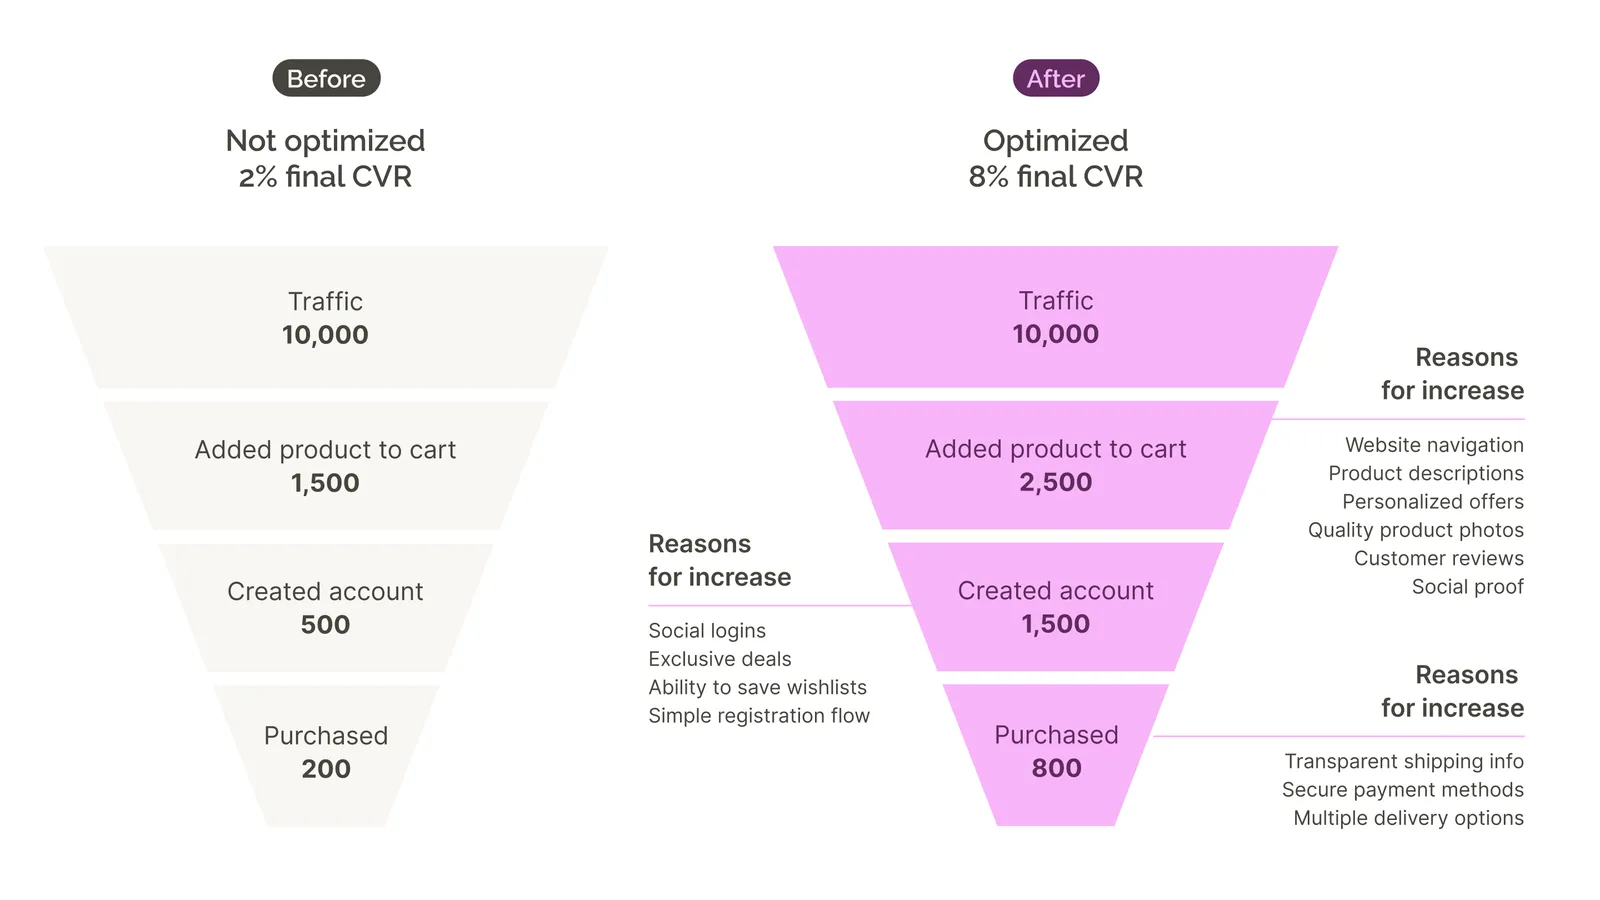
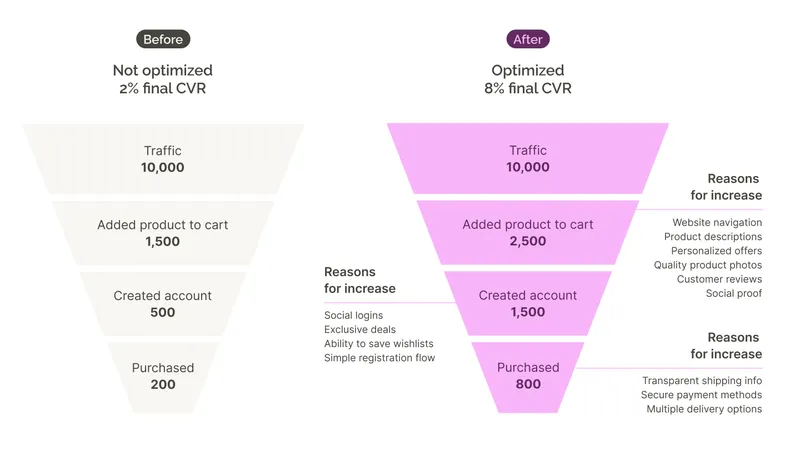
Here's an example of how conversion rate optimization can help improve performance:
Macro vs micro conversions
Type
What it is
Examples
Macro conversion
The action your business exists to get. A site usually has one, sometimes two.
A completed purchase, a trial signup, a booked demo
Micro conversion
The smaller actions worth counting on the way there.
Steps on the path: add to cart, started checkout, a form begun, newsletter signup, wishlist save, account created
Micro conversions happen far more often than purchases, so tests built on them reach a result faster. Macro conversions still confirm whether a change brought in more revenue.
Reading the two together shows where the problem sits. A rise in add-to-carts with no rise in orders points to something later in the funnel, such as shipping costs or the checkout steps.
Micro conversions also make useful triggers for retargeting. Repeated views of one product or an abandoned cart both signal interest worth following up on.
How to calculate your conversion rate
The global average ecommerce conversion rate in 2026 is about 2% (IRP), but one should treat that as context rather than a target. Conversion rates change by country, industry and business, which makes your own the best benchmark: where you were last quarter, and whether you have beaten it since.
For reference, companies already running onsite campaigns average 4.82%, with the top 10% of campaigns reaching 57.7%, according to Wisepops' proprietary stats.
A conversion rate formula you can use:
Conversion Rate = (Number of conversions / Total visitors) x 100
For example, if 50 people made a purchase out of 1,000 visitors, the conversion rate of the entire website would be:
(50 / 1000) × 100 = 5%
Additionally, the pricing of your products plays a significant role. If your average order value is above $50, expect a decline in conversions. Some purchases also require customers to take more time before deciding.
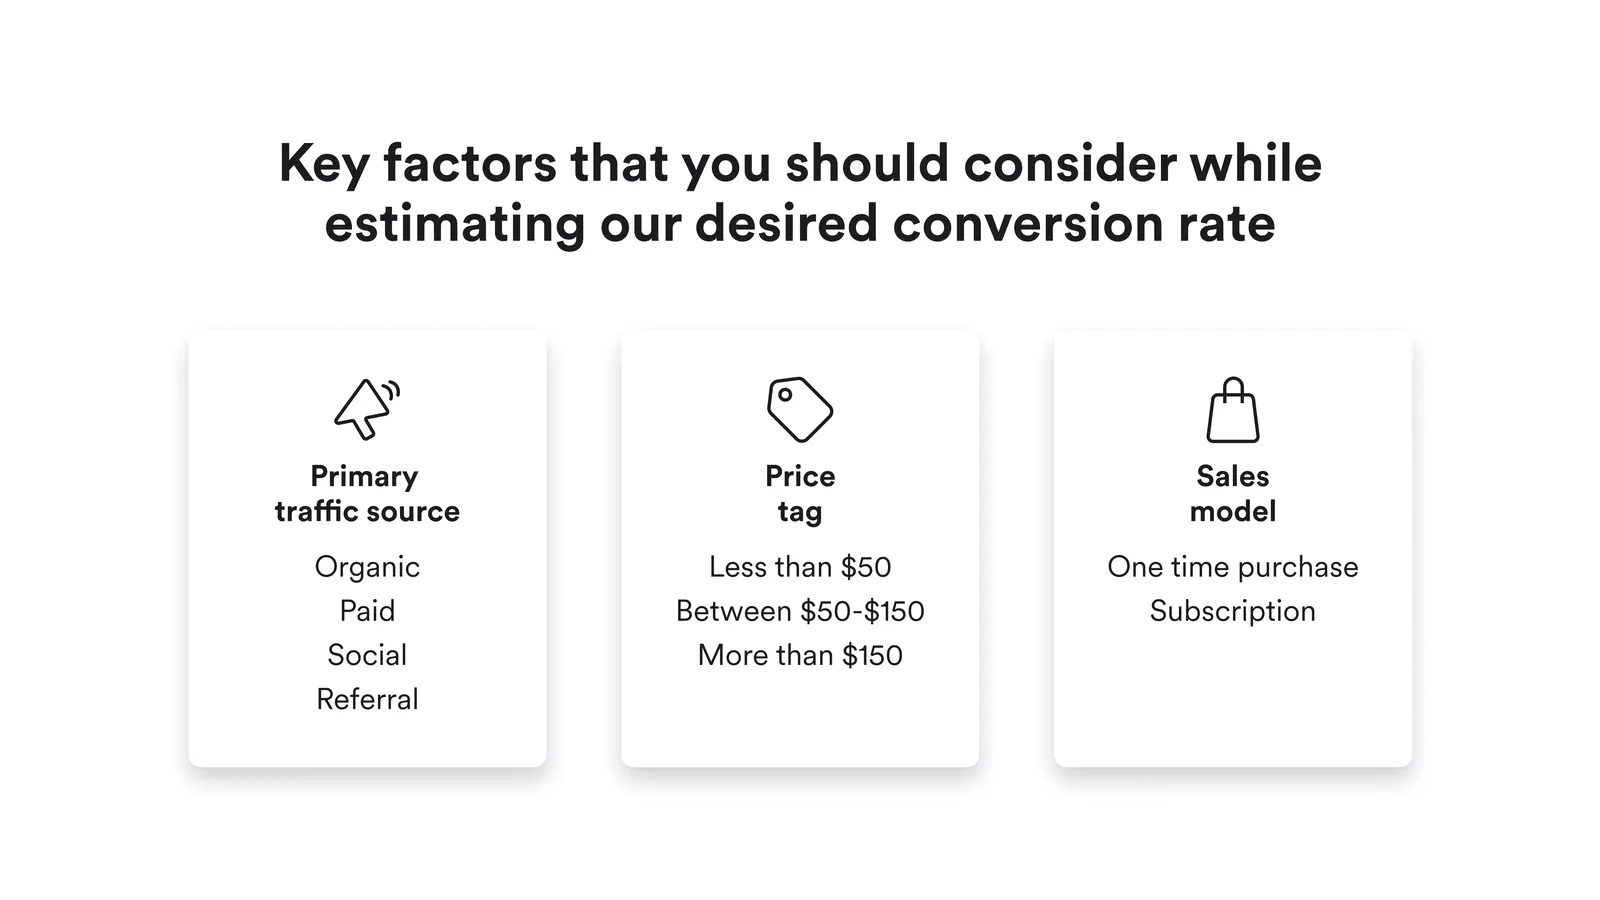
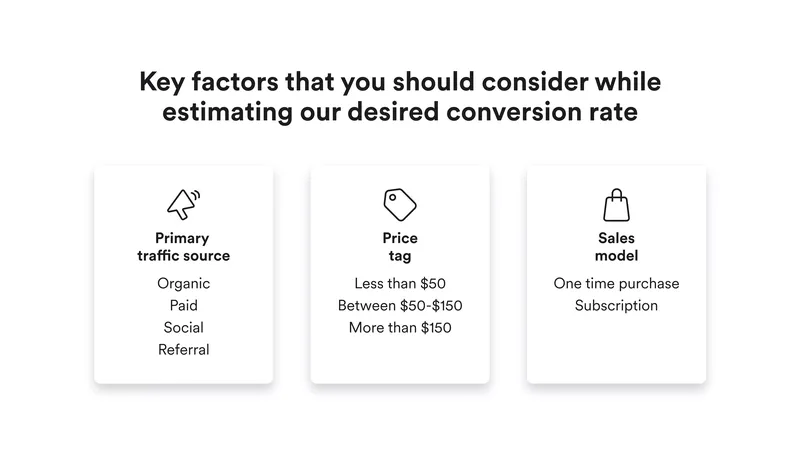
Still, certain CRO strategies prove effective regardless of whether you occasionally sell a $500 item or hundreds of smaller orders on a daily basis.
Note: calculate conversion rates for one specific action at a time. A website can convert 5% of visitors into newsletter signups and only 1% into buyers.
The goal of CRO is to identify goals that are most important for your business and maximize your website's effectiveness.
Onsite signup conversion rate benchmarks
Across 1 billion popup displays analyzed for our 2026 report, the average onsite signup conversion rate is 4.82%. Ecommerce sits highest at 6.88%, B2B lowest at 2.01%.
Segment
Average signup conversion rate
All campaigns
4.82%
Ecommerce
6.88%
Media
3.70%
Education
2.40%
B2B
2.01%
Mobile
4.98%
Desktop
3.67%
Shopify stores
6.97%
Other platforms
4.73%
Note: these are signup conversion rates, calculated as emails collected divided by popup displays. They are not whole-site conversion rates and the two aren't comparable. Use them to judge your onsite signup performance, not your checkout.
Signup rates of the top 10% of campaigns
The averages above include every campaign in each group, from first drafts to campaigns refined over several tests. The top 10% of campaigns in the same groups show how much higher a well-built campaign can convert.
Average and top 10% signup rates by group:
Onsite signup rates
The top 10% of campaigns convert at about 12 times the average
Average and top 10% signup rates by group.
Source: Wisepops popup benchmark 2026, based on 1 billion popup displays.

Running a Shopify store? Platform-specific fixes for themes, apps and checkout:
The CRO process, step by step, with best practices
CRO takes effort, but the process behind it is simple: set a conversion goal, look at what your visitors are actually doing, find where you lose them, change one thing, then check whether it worked. The strategies below follow that order.
The first six build your conversion rate optimization plan:
The rest are CRO best practices to apply once you know where the problem is:
1. Set conversion goals tied to business objectives
Conversion goals connect what the business needs with what visitors do on the site. Setting them starts with the business objective, such as growing first-time sales or generating demo requests, and works down to the actions on the site that serve it.
Choose one primary goal, usually the macro conversion, and a few supporting goals that lead up to it. The right ones depend on the type of website:
Ecommerce
SaaS
Content and education
Completing a purchase
Signing up for a free trial
Following your social media profile
Adding products to the shopping cart
Upgrading to a paid plan
Downloading a whitepaper or ebook
Creating an account
Completing onboarding
Registering for a webinar or event
Signing up for a newsletter or promotional emails
Using in-app features
Sharing content on social media
Using a wishlist feature
Providing user feedback
Leaving comments
Leaving a review
Engaging with live chat or chatbot
Making a donation
Each goal then needs a way to measure it. Working from the objective to the visitor segment, every step narrows the one before it:
Measuring a goal
From business objective to visitor segment
Each step narrows the one before it. Example: an online store growing first-time sales.
01
Business objective
Why the website exists
Grow online revenue from first-time buyers
02
Goal
What visitors need to do
First purchase, supported by add to cart and newsletter signup
03
KPI
Which number shows progress
Conversion rate from new visitor to first order
04
Target
What counts as success, and by when
From 1.8% to 2.2% by the end of the quarter
05
Segment
Which visitors to measure separately
Mobile and desktop, paid and organic traffic
A number on its own still says little about whether the target is worth reaching. Four checks make it meaningful:
Start from your baseline. Use several months of your own data and adjust for seasonal peaks, so the target reflects where the site actually stands.
Check the break-even rate. Work out the minimum conversion rate a paid campaign needs to cover its cost: cost per click divided by profit per order. At $1 per click and $40 profit per order, anything under 2.5% loses money.
Give each goal a value. A newsletter signup worth $3 in later orders and a purchase worth $80 carry very different weight when you decide what to test first.
Pick one primary goal per test. Track the other goals alongside it, so you can see whether a change raises one goal at the expense of another.
Agree on targets with the people accountable for the results, such as management or finance, so everyone judges success against the same numbers.
2. Track where and why visitors leave your site
Before you change anything, you need two kinds of data. Analytics show where visitors drop off and how many you lose at each step. User research shows why they leave.
What to track in your analytics
GA4 or any other analytics tool works, as long as every goal from step 1 is tracked as its own conversion event. These are the CRO metrics worth reporting for each goal:
Metric
What it tells you
Conversion rate per goal
How often visitors complete each macro and micro conversion
Revenue per visitor
Whether more conversions brought in more money
Drop-off between funnel steps
Which page or step loses the most visitors
Exit rate by page
Where visitors give up and leave the site
Conversion rate by segment
Which devices, traffic sources or visitor types convert below the rest
Revenue matters as much as the conversion count. A campaign that doubles your signups and leaves revenue flat isn't necessarily a win, and you only find that out if you're tracking both.
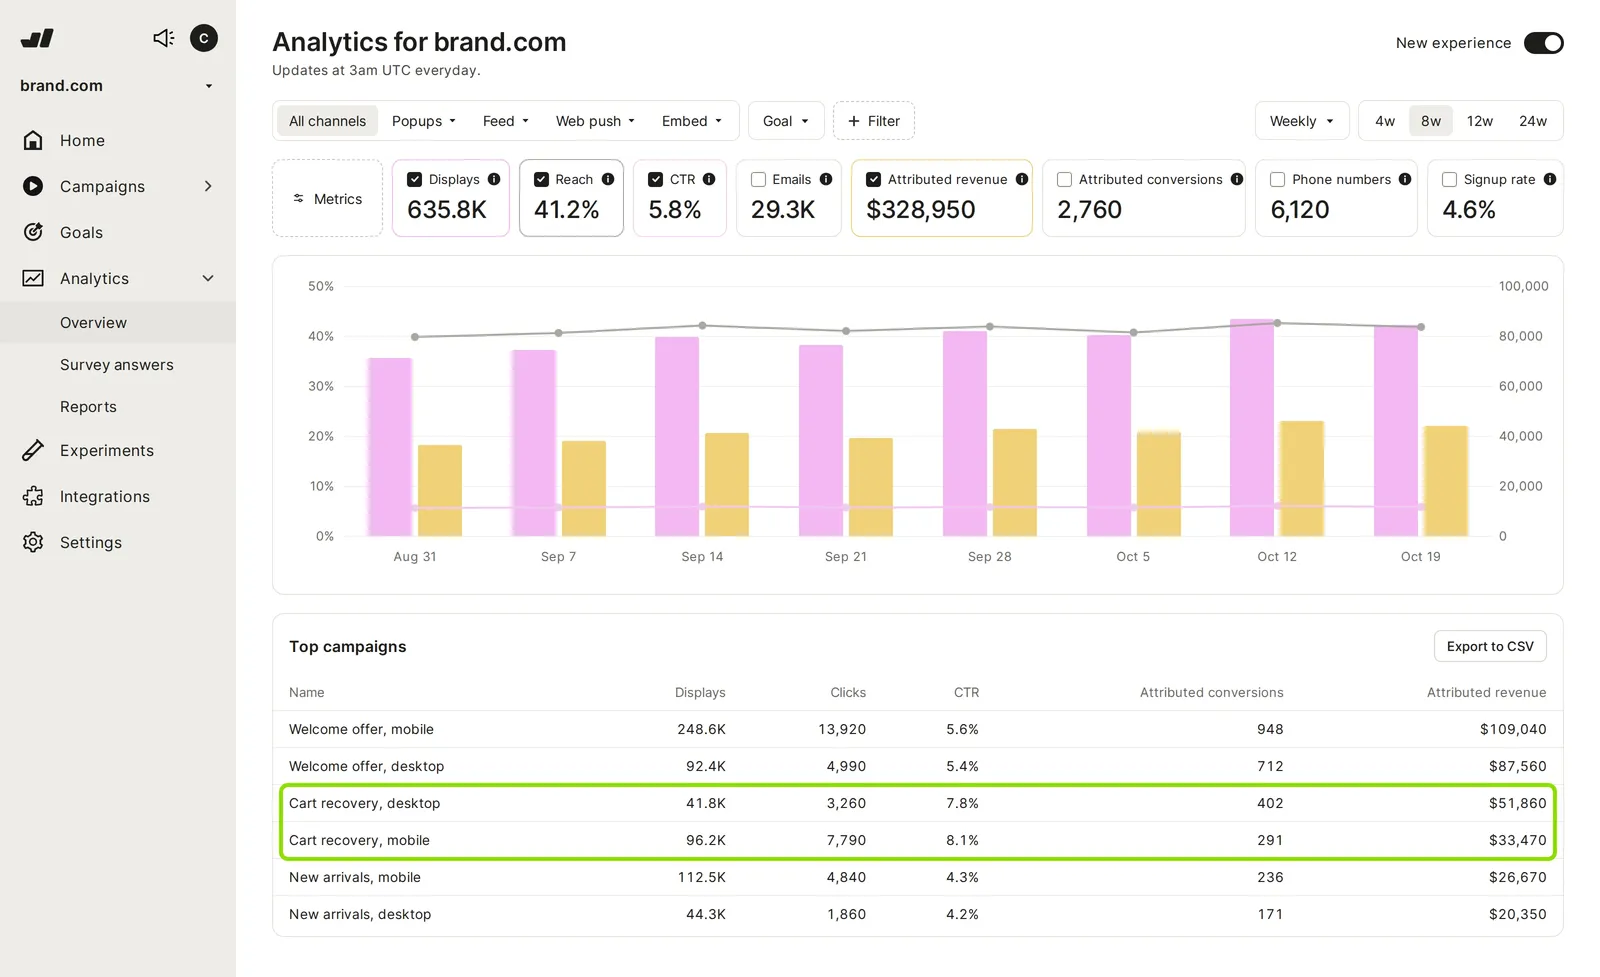
Split every rate by device, traffic source and new versus returning visitors. A site-wide 2% can hide mobile at 1% and desktop at 3%, and each of those needs a different fix.
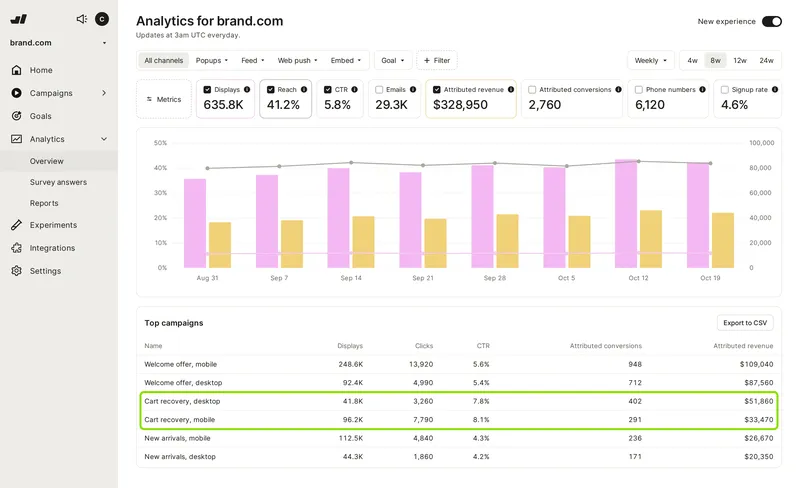
In this example, the same cart recovery campaign runs on mobile and desktop:
Record a baseline before you change anything. A few weeks of stable numbers gives every later test something to compare against.
How to find out why visitors leave
Analytics can show that a product page loses 60% of its visitors. They can't show whether the price, the photos or a broken size selector caused the drop.
Qualitative research answers that question. Four methods cover the ground between them:
Heatmaps show where visitors click, how far they scroll and which elements they ignore, across many sessions.
Session recordings replay individual visits, so you can watch someone hesitate on a form field or click something that isn't a link.
Onsite surveys ask one question at the moment it matters, on exit or after checkout. See these popup survey best practices.
Customer interviews and support tickets give you the objections people raise, in their own words.
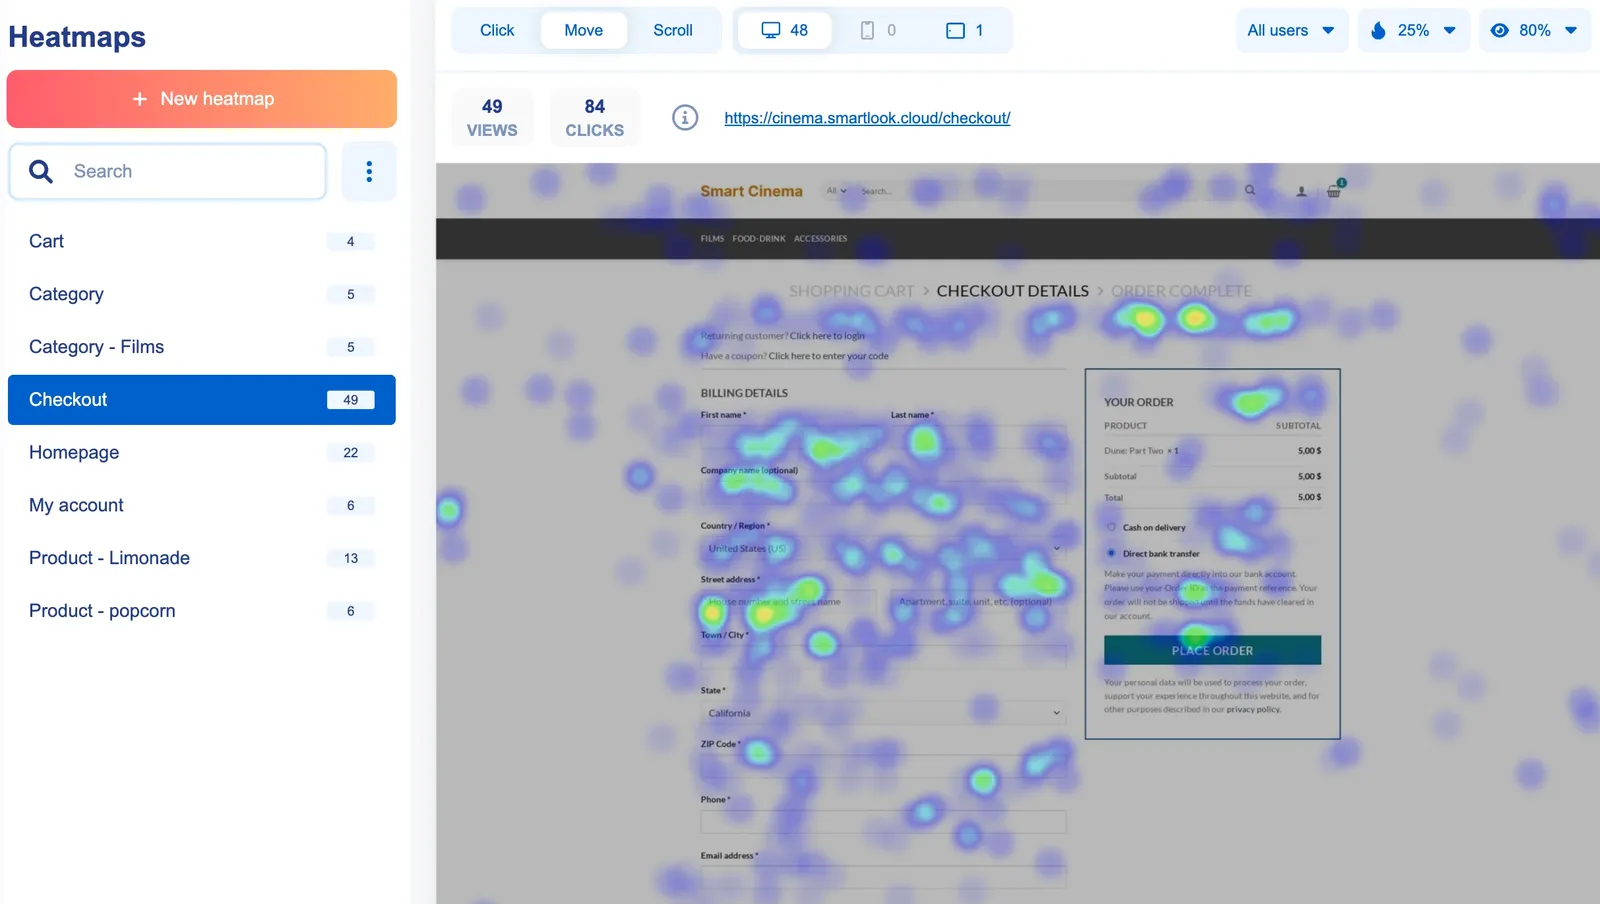
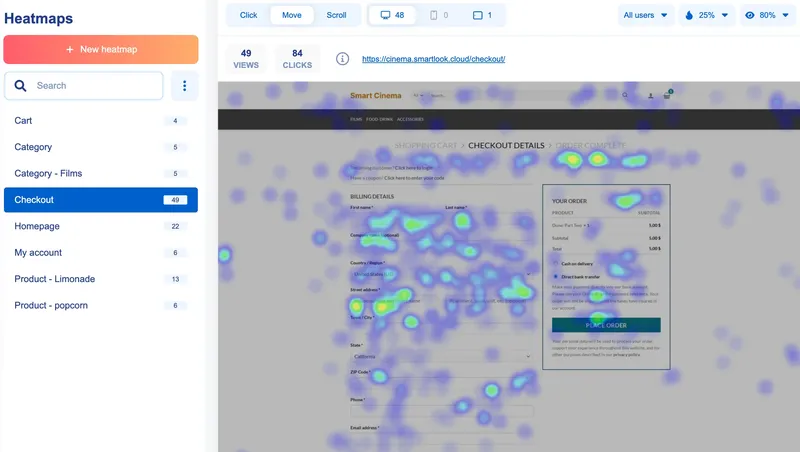
Heatmaps often show that visitors scroll less than expected. If your first call-to-action sits halfway down the page, a large share of visitors never sees it, so consider moving it closer to the top.
Read the two kinds of data together. When recordings show visitors hesitating on the same step your analytics flags, you've found the first problem worth testing.
3. Map the pages visitors pass through before converting
Your conversion funnel is the sequence of pages a visitor moves through before they convert. Start by writing yours down as it actually exists. For an ecommerce site that's usually landing page, product page, cart, checkout. For SaaS it's closer to landing page, pricing, signup, activation.
Those pages line up with the stages a visitor goes through on the way to converting, often called awareness, interest, desire and action:
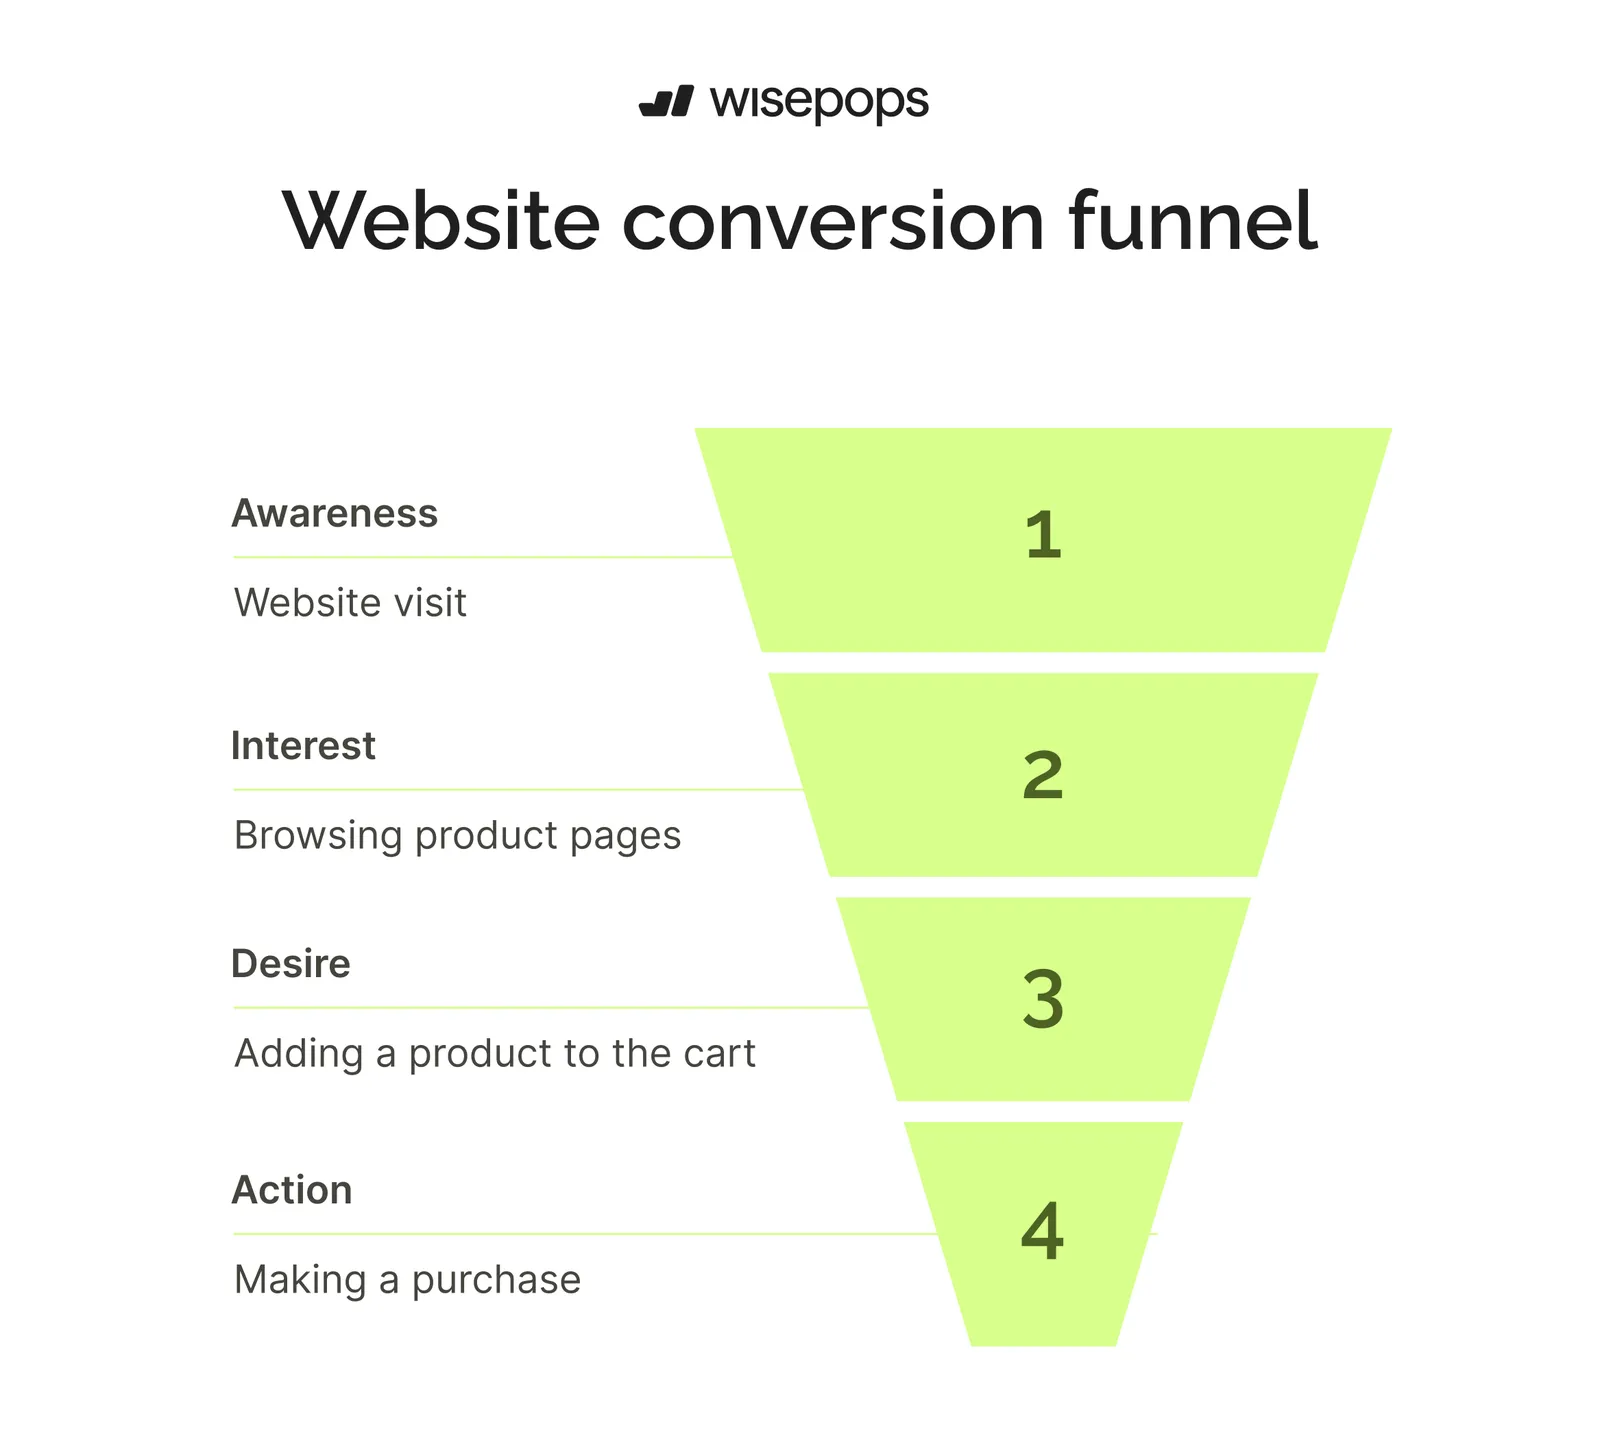
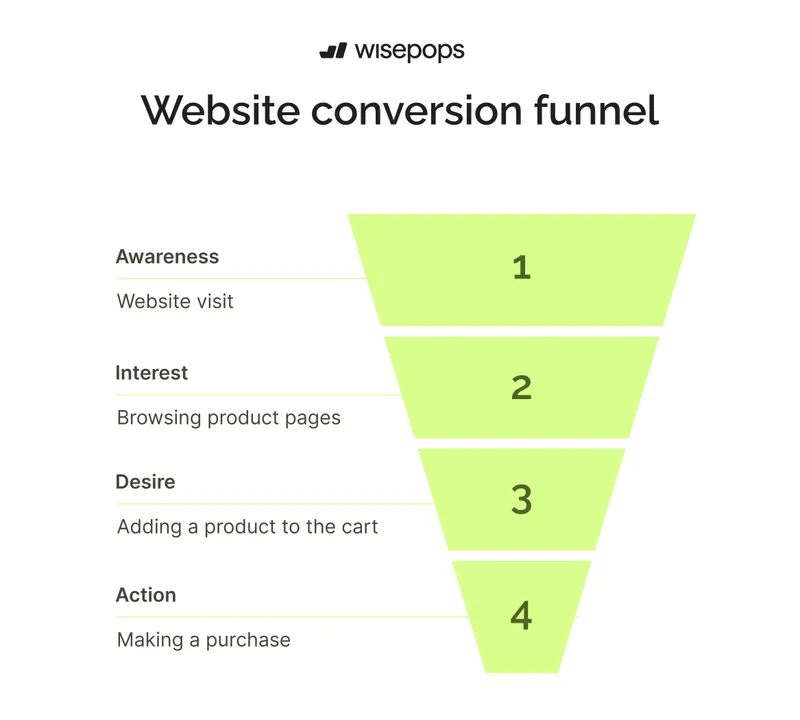
For example, your funnel might look like this:
10,000 land on your site
4,000 reach a product page, so 6,000 dropped off
400 reach the checkout, so another 3,600 dropped off
Every one of those drops is somewhere you can work. Your landing page, your category and product pages and your checkout each lose people for different reasons, and each has its own ways of keeping them. The rest of this guide covers those.
Mapping the funnel first is what tells you which drop to start with.
Short on time? The Traffic Activation Audit does this for you. You add a snippet, and it watches anonymous visitor behavior for 7 to 10 days. A 30-minute call then shows how your traffic moves through your site, broken into behavioral segments, with 4 to 6 campaign recommendations and mockups. It's free.
Learn more:
4. Remove friction that stops visitors from converting
Friction on a website is every factor that worsens the experience and makes it more difficult for a visitor to complete a conversion.
Some of it is obvious: a checkout that lacks a shopper's preferred payment method loses the sale outright. Other sources of friction are harder to spot, such as a visitor who wants to buy but can't work out which product to choose.
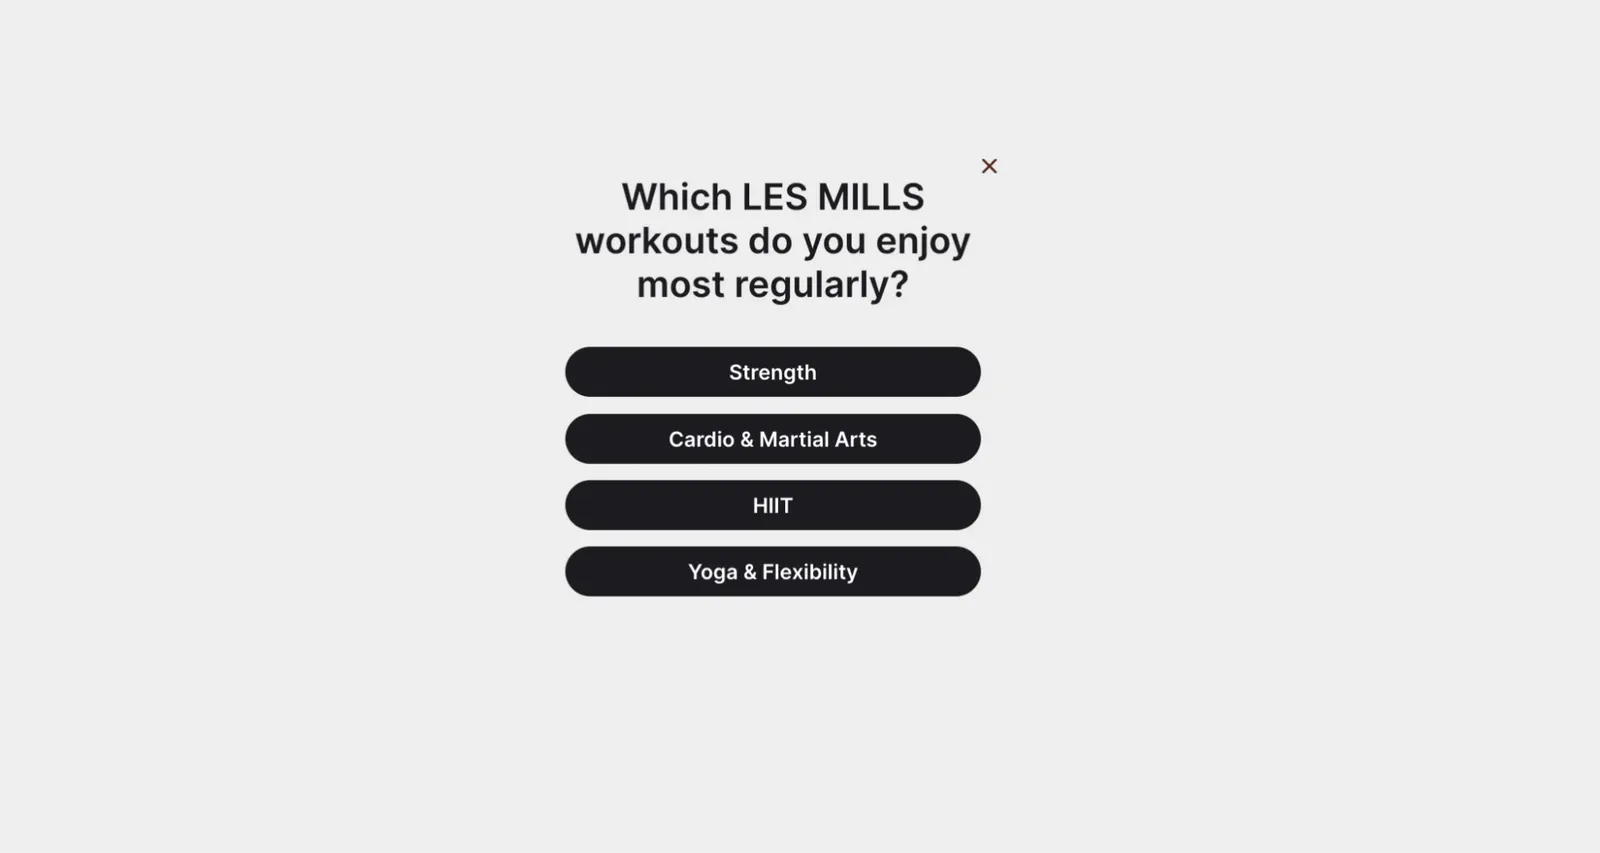
Les Mills, the New Zealand fitness company, sells home workout equipment through its UK online store, with prices from £30 to £950. With a range that wide, visitors kept browsing without settling on a product.
A short quiz now asks about fitness goals and home setup, recommends a product, then asks for an email at the end. It captured 36.6% of the visitors who saw it, against a 0.5% average across the site.
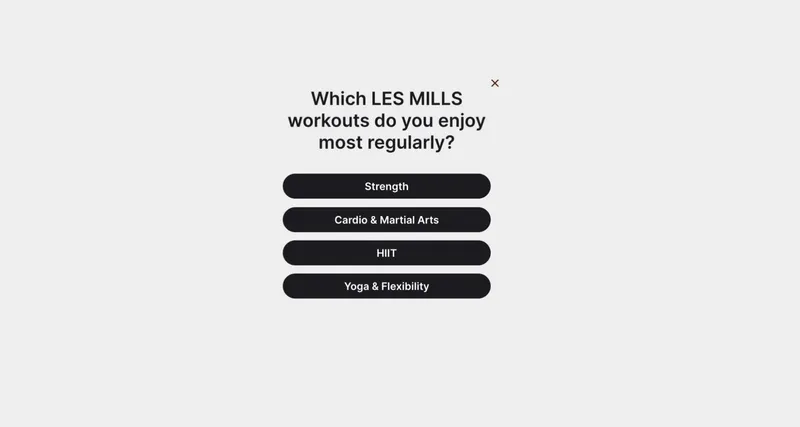
Practical ways to take friction out of an ecommerce funnel:
Friction point
How to spot it
How to fix it
Missing payment methods
People reach checkout and leave without paying, especially on mobile
Add the wallets and local methods your customers actually use
Too much choice
Healthy traffic on product pages, low add-to-cart rate
Guide the decision with a quiz or product recommendations instead of leaving people to browse
Forms that ask too early
High form or campaign views, low completions
Give something first, then ask. Split long signup forms into steps
Forced account creation
Drop-off at the account step
Offer guest checkout and social login
Unexpected costs
Drop between cart and checkout
Show shipping and fees before the final step, for example with a sticky bar tracking the free shipping threshold
Slow pages
High exit rate on landing, worse on mobile
Audit what scripts and tools you have added and remove what isn't earning its place
5. Turn research findings into test ideas and rank them
Research leaves you with a list of problems. A hypothesis turns one of them into a change you can test, with a reason behind it and a number to watch.
A useful hypothesis follows a fixed structure:
If we [make this change] for [this audience], then [this metric] will improve, because [what the research showed].
For example: if we show delivery costs on the product page for mobile visitors, then checkout completion will improve, because recordings show them leaving at the shipping step.
You'll usually end up with more hypotheses than you can test at once. A scoring model ranks them, and PIE is a common one:
Factor
Question to ask
Potential
How much room for improvement does this page or step have?
Importance
How much traffic or revenue goes through this page or step?
Ease
How much work does the change take to build and test?
Score each factor from 1 to 10 and average the three. Start with the highest score, and keep the rest as your testing backlog.
6. A/B test each change before rolling it out
A/B testing, or split testing, means comparing two versions of a single element, such as a headline, a CTA or a landing page, to see which performs better. Deciding from that data is what lets you grow, lower customer acquisition costs and get more from the traffic you already have.
What does it look like in practice?
Say you want to know whether urgency sells. You split your traffic in half and show each group a different discount popup:
Version A: a basic discount campaign
Version B: the same campaign with a countdown timer
After a month, with 10,000 visitors seeing each version:
Version
CTR
Sales
Conversion rate
Version A
6%
200
2%
Version B
12%
400
4%
Here is how the same test reads in an experiment report:
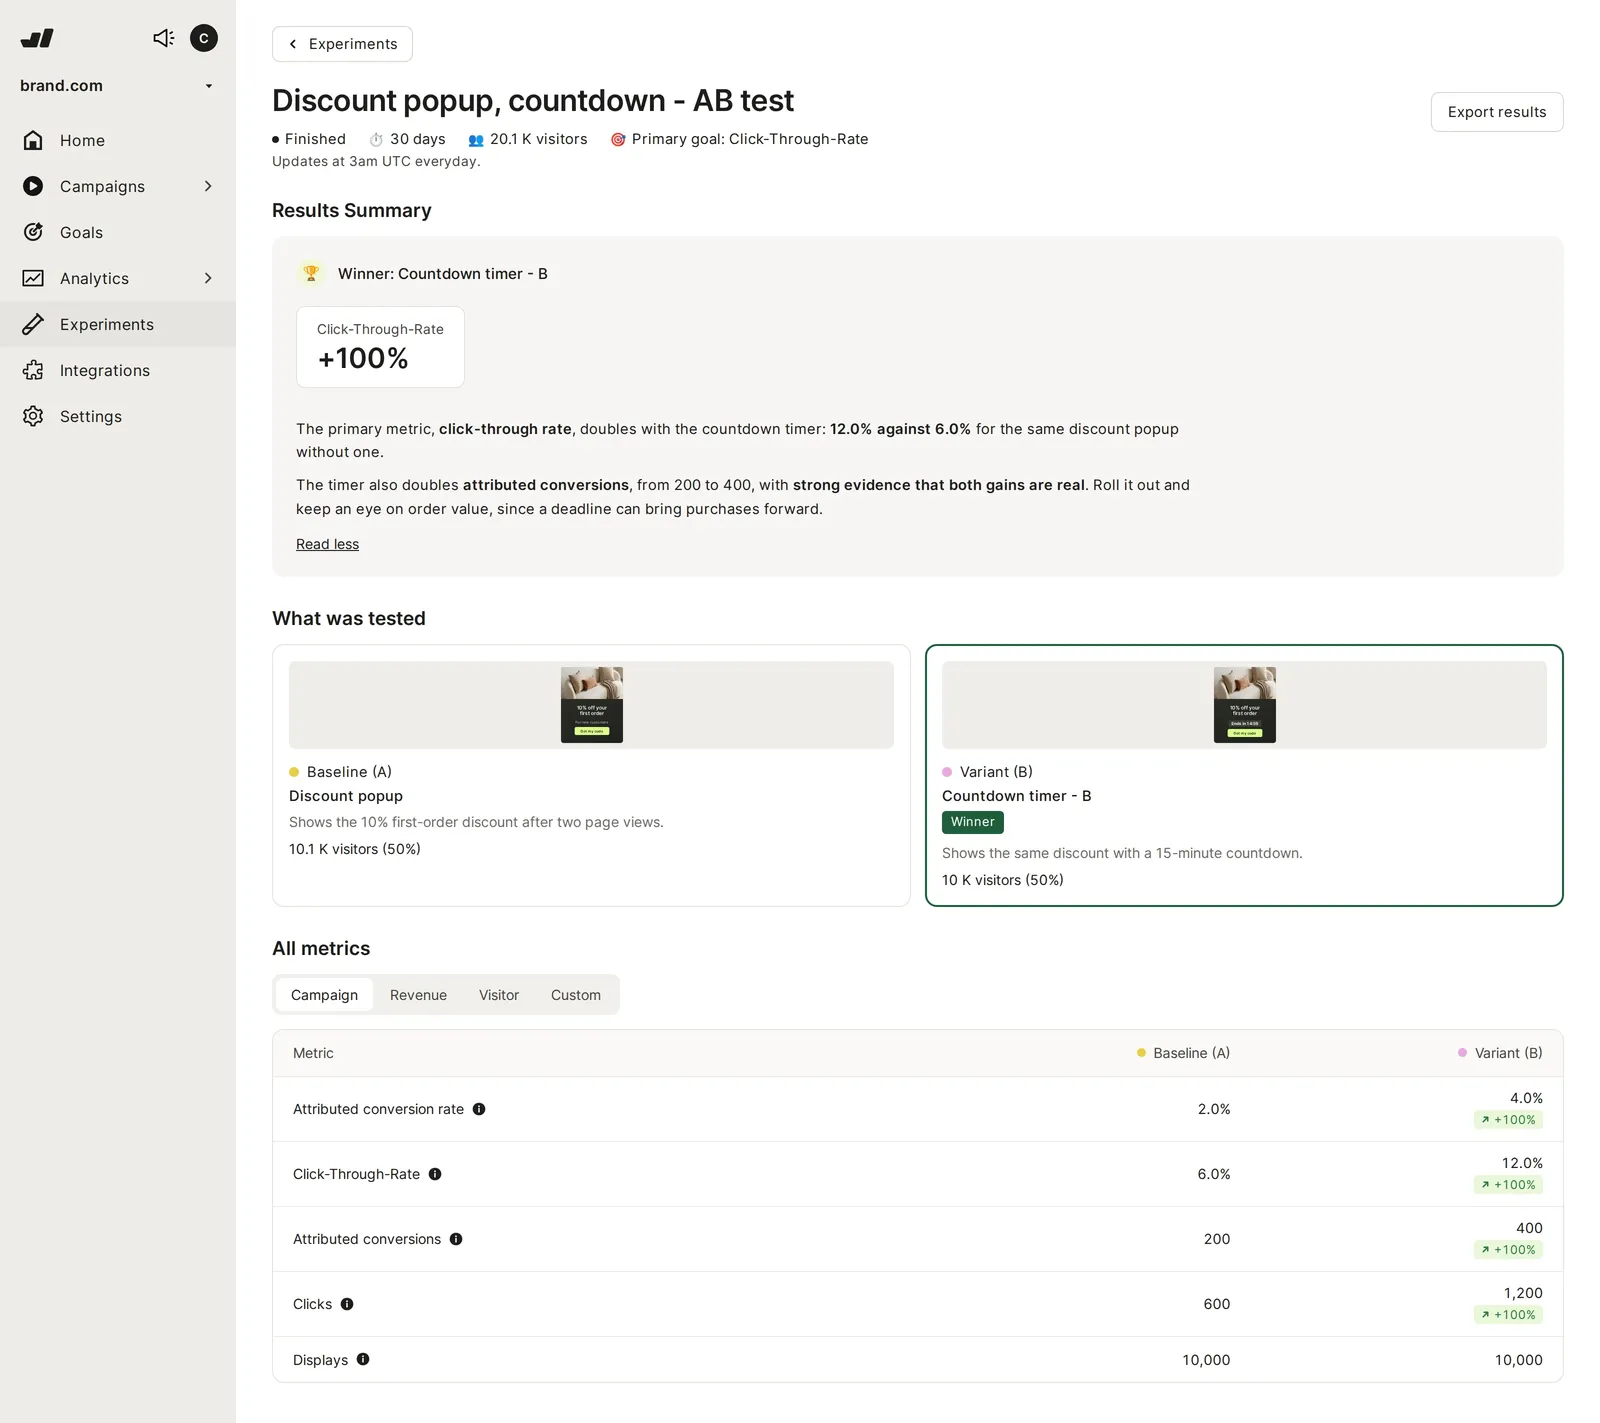
In this CRO example, the results are quite clear-cut. A higher number of visitors and significant differences in conversion rates increase the certainty of the A/B test. When the gap is smaller, use an A/B testing statistical significance calculator to validate your results.
When a variant wins, make the change permanent and move to the next idea in your backlog. When nothing wins, the result still rules out one explanation, so record it before you plan the next test.
7. Write calls-to-action that say what the click does
Calls-to-action (CTAs) play a vital role in guiding website visitors towards desired actions and improving conversion rates. To maximize their effectiveness, it's crucial to create clear and compelling CTAs that encourage users to take the next step.
Use action-oriented language. Say what the click does. "Download our free ebook" beats "Learn more".
Name the offer, not the action. "Get 15% off" works harder than "Sign up", because it tells people what they're getting rather than what they're doing.
Show urgency instead of claiming it. A clock running down next to the button does more than the words "limited time offer".
Be creative. Make the user engage with your brand instead of just asking for information.
Emma, the mattress brand, does this well. Rather than a newsletter form with a "Sign up" button, they ask a question and put an answer on each button. Nobody clicks "Submit", they click the option that describes them, and Emma learns something about that visitor while capturing the email.
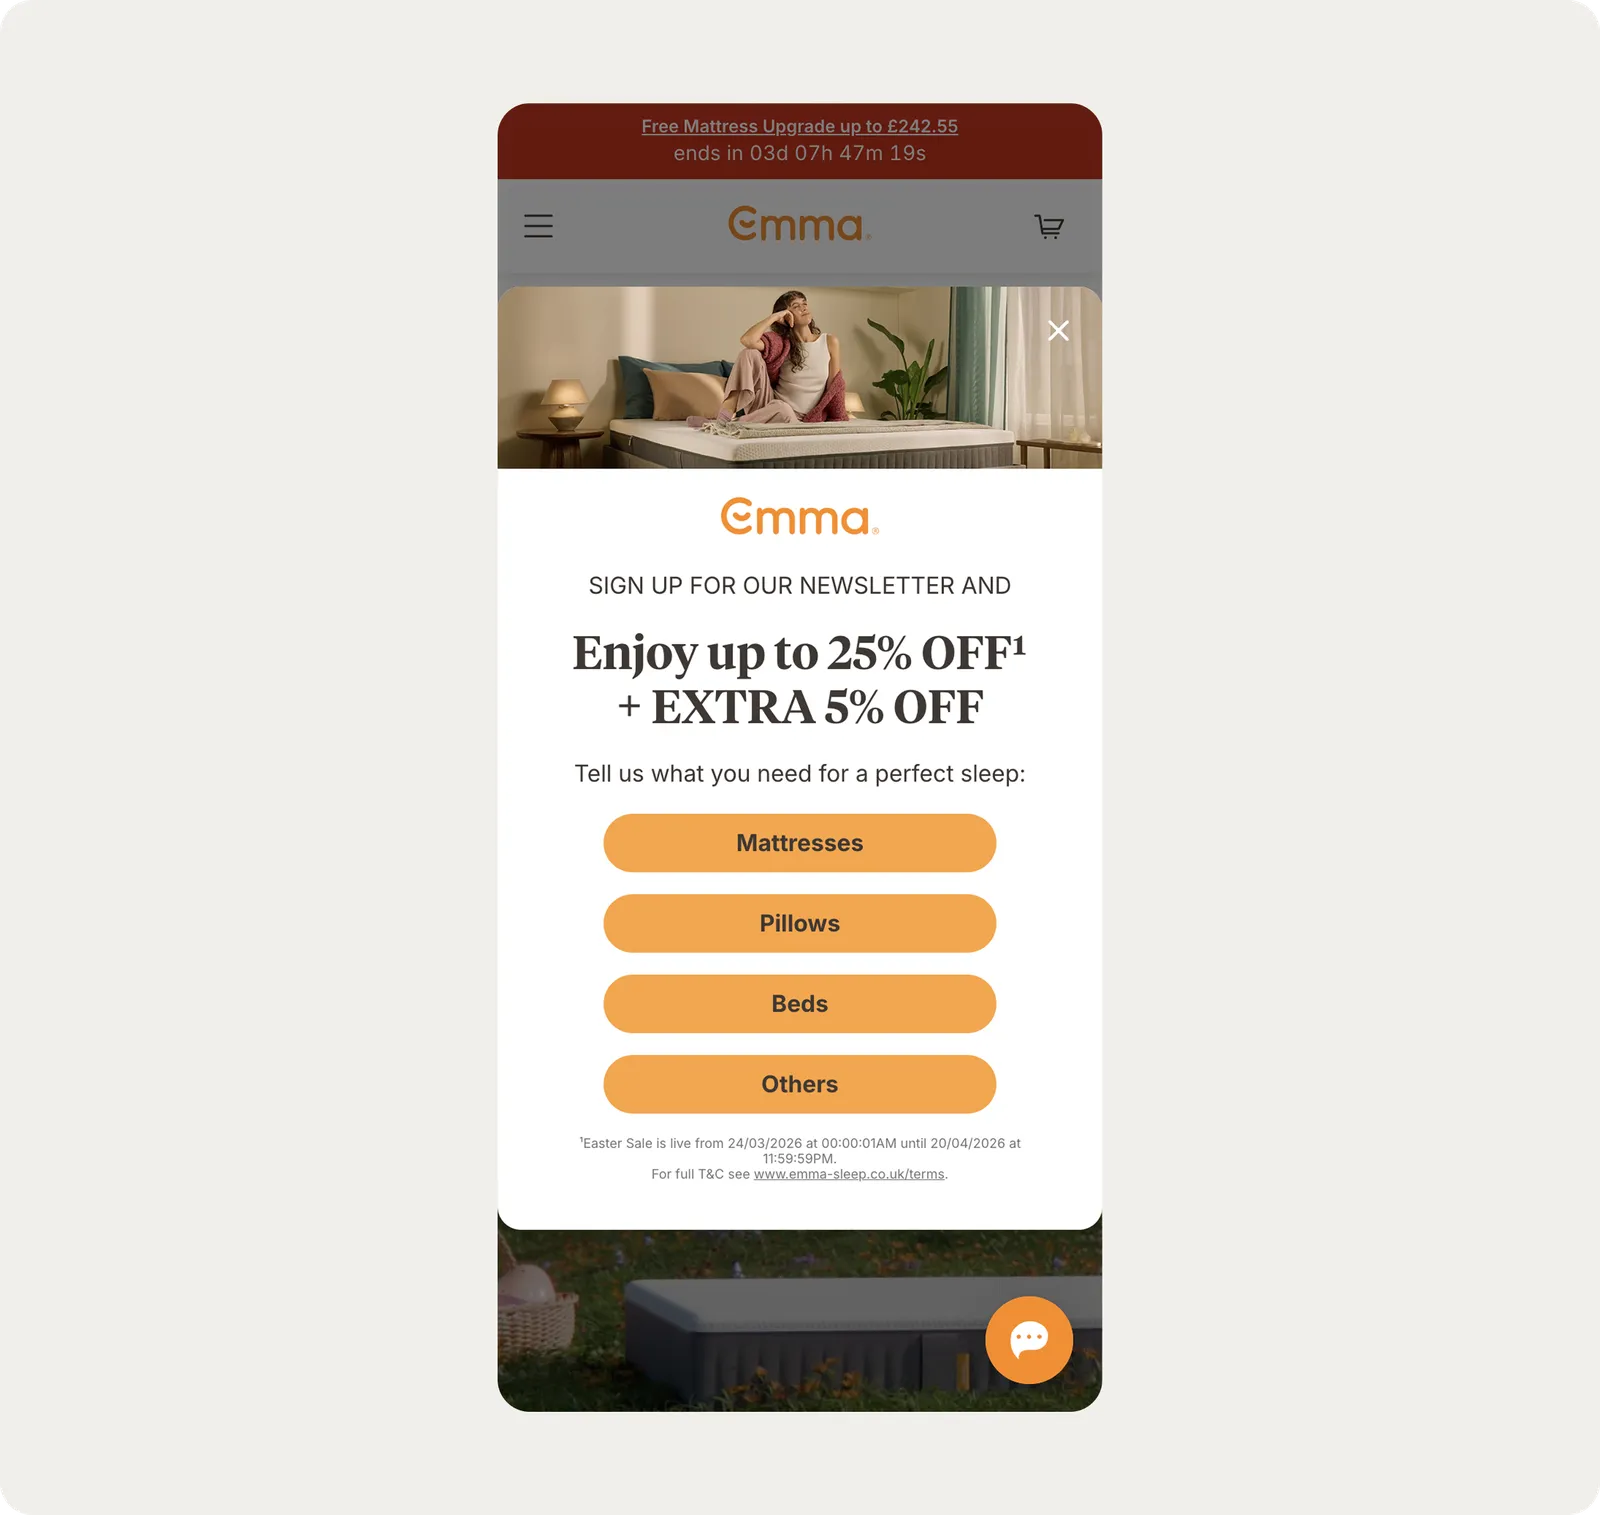
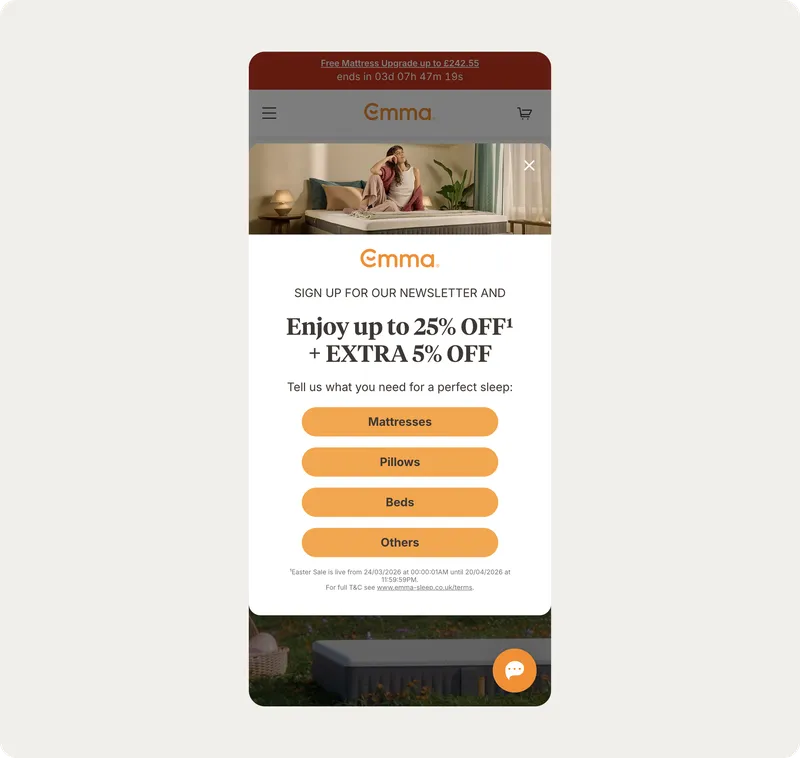
Ensure that your CTAs stand out on the page by using contrasting colors, bold fonts, and eye-catching designs. A well-written call-to-action can raise click-through rates on its own, so test the button copy as carefully as the headline.
Learn how to convert more visitors with marketing offers:
. Add reviews and social proof where visitors decide
In the realm of CRO, social proof plays a crucial role, as people tend to follow the actions of others. Showcasing testimonials, reviews, and case studies builds trust and credibility, leading to improved conversion rates.
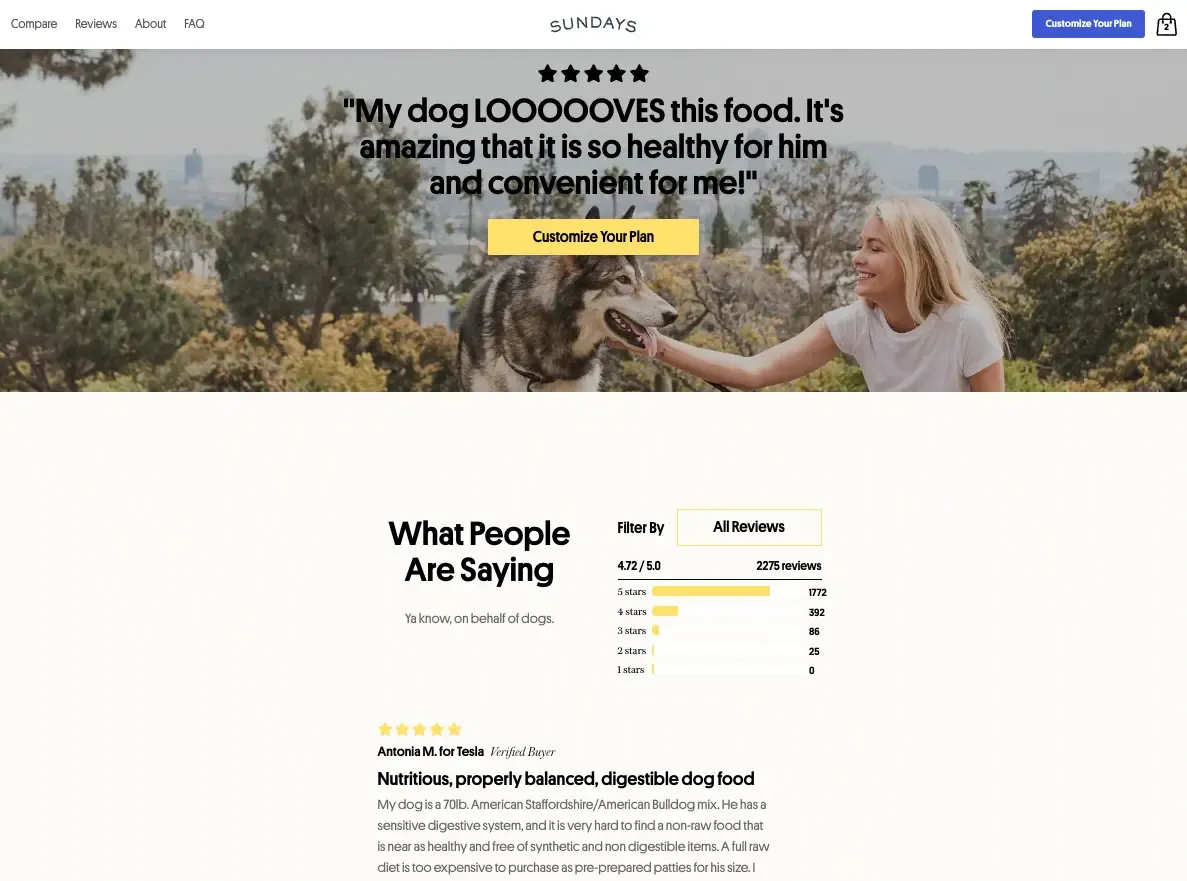
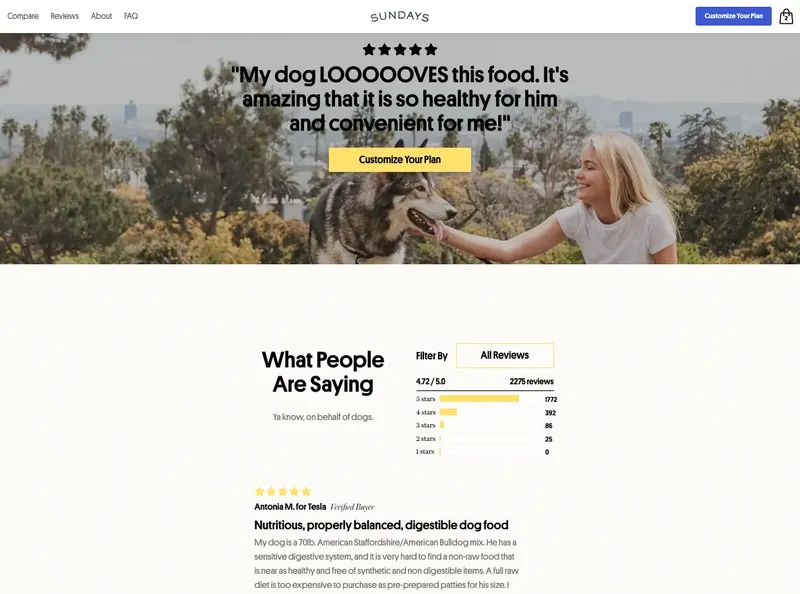
Incorporate social proof on your website by:
Featuring customer testimonials or reviews. Share genuine and relatable customer experiences, with photos or videos, to highlight the benefits of your products or services. Use rotating carousels or dedicated pages for maximum impact.
Highlighting industry awards or certifications. Prominently display these achievements, providing third-party validation to boost your brand's credibility.
Showcasing well-known clients or partners. Build trust by demonstrating that reputable organizations rely on your products or services.
Displaying real-time sales or customer activity. Create a sense of urgency and FOMO by showcasing recent purchases, reviews, or sign-ups.
Nutrimuscle, a sports nutrition brand, does this with people rather than star ratings. Their NM Club campaign features the athletes they sponsor, including UFC fighter Benoit Saint Denis, so the endorsement comes from names their audience already follows.
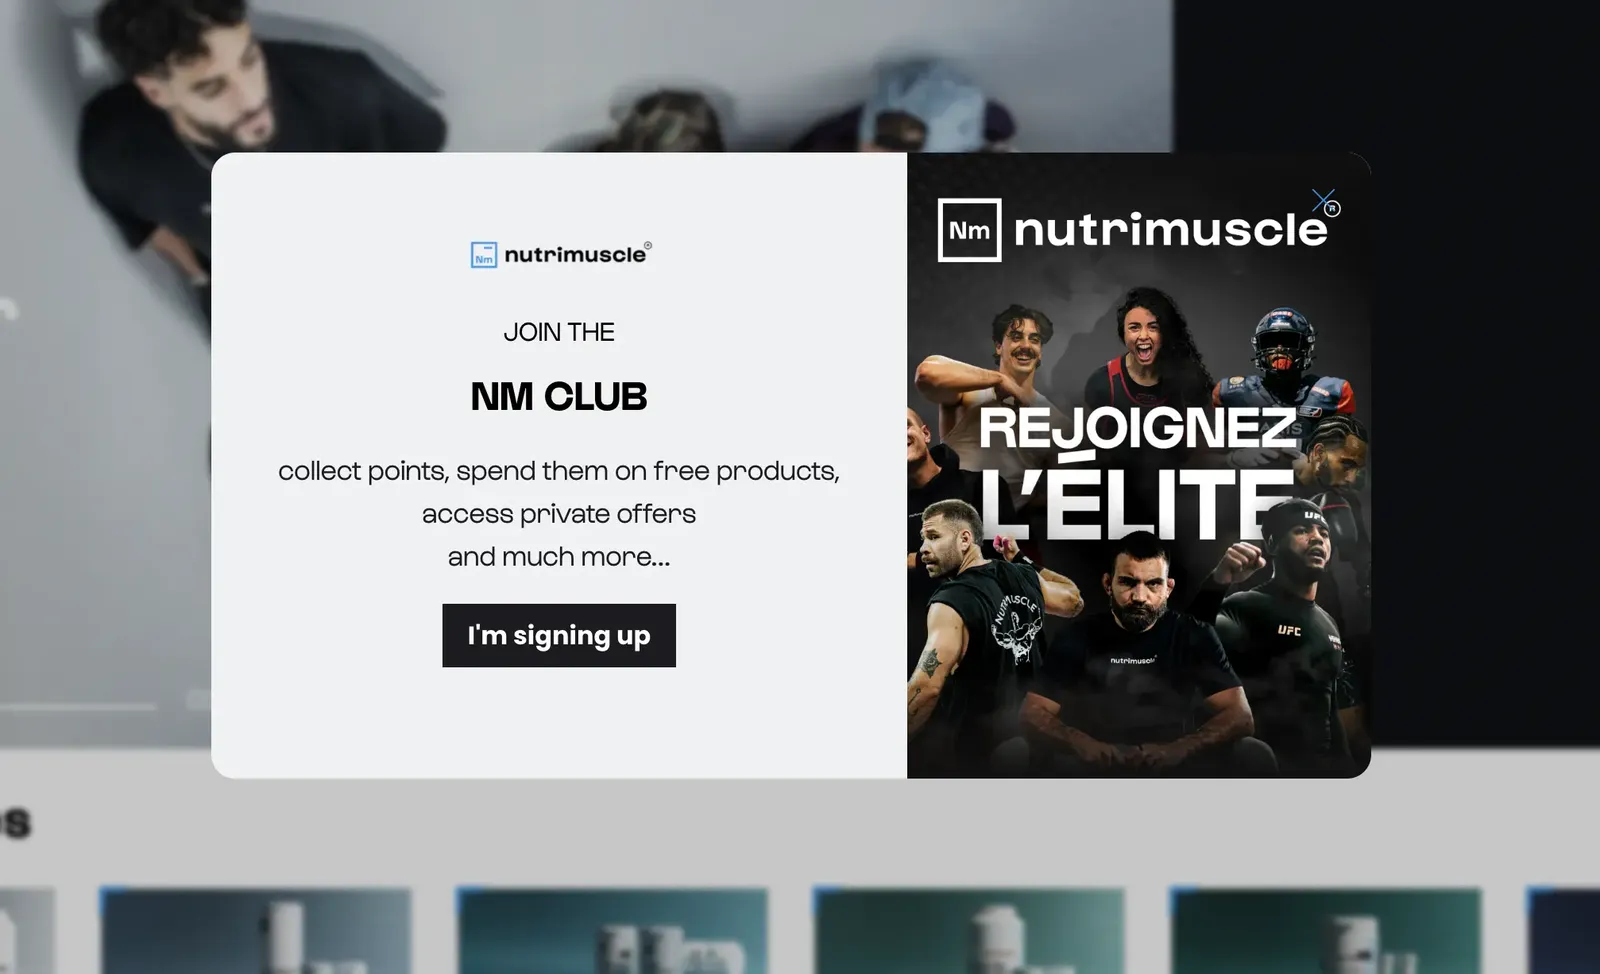
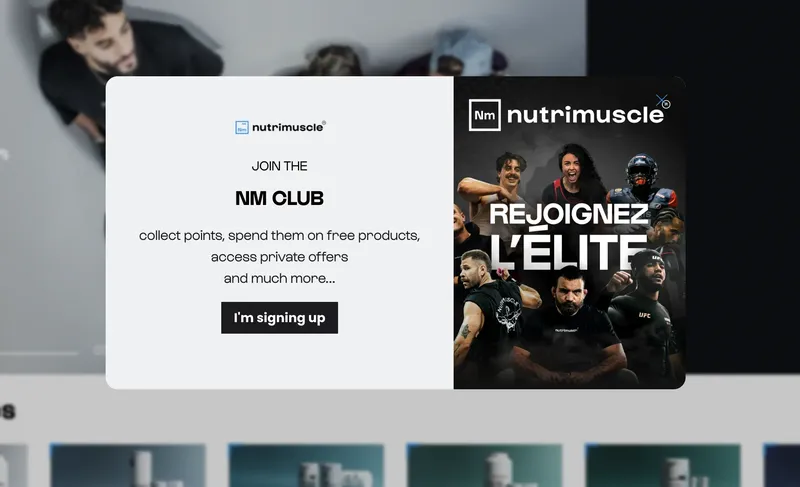
Ensure your social proof elements are genuine, relevant, and regularly updated for optimal results. If you are using an ecommerce platform like Shopify, utilize dedicated plugins. Showcasing your product reviews can be a critical part of your Shopify marketing strategy.
9. Reduce bounce rate with content that matches visitor intent
Bounce rate is the percentage of visitors who leave your website after viewing just one page. It's high when people arrive and find no reason to stay. There are two ways to fix that: the content itself, and onsite campaigns that engage people before they leave.
Start with the content. Research your target market for:
Demographics. Who they are, and what they're able to spend.
Interests. What they already care about and search for.
Pain points. The problem that brought them to your site in the first place.
Then write for what you find. If you sell eco-friendly activewear, that might be in-depth guides and comparisons covering sustainability features, materials and benefits, and how each product stacks up against similar ones.
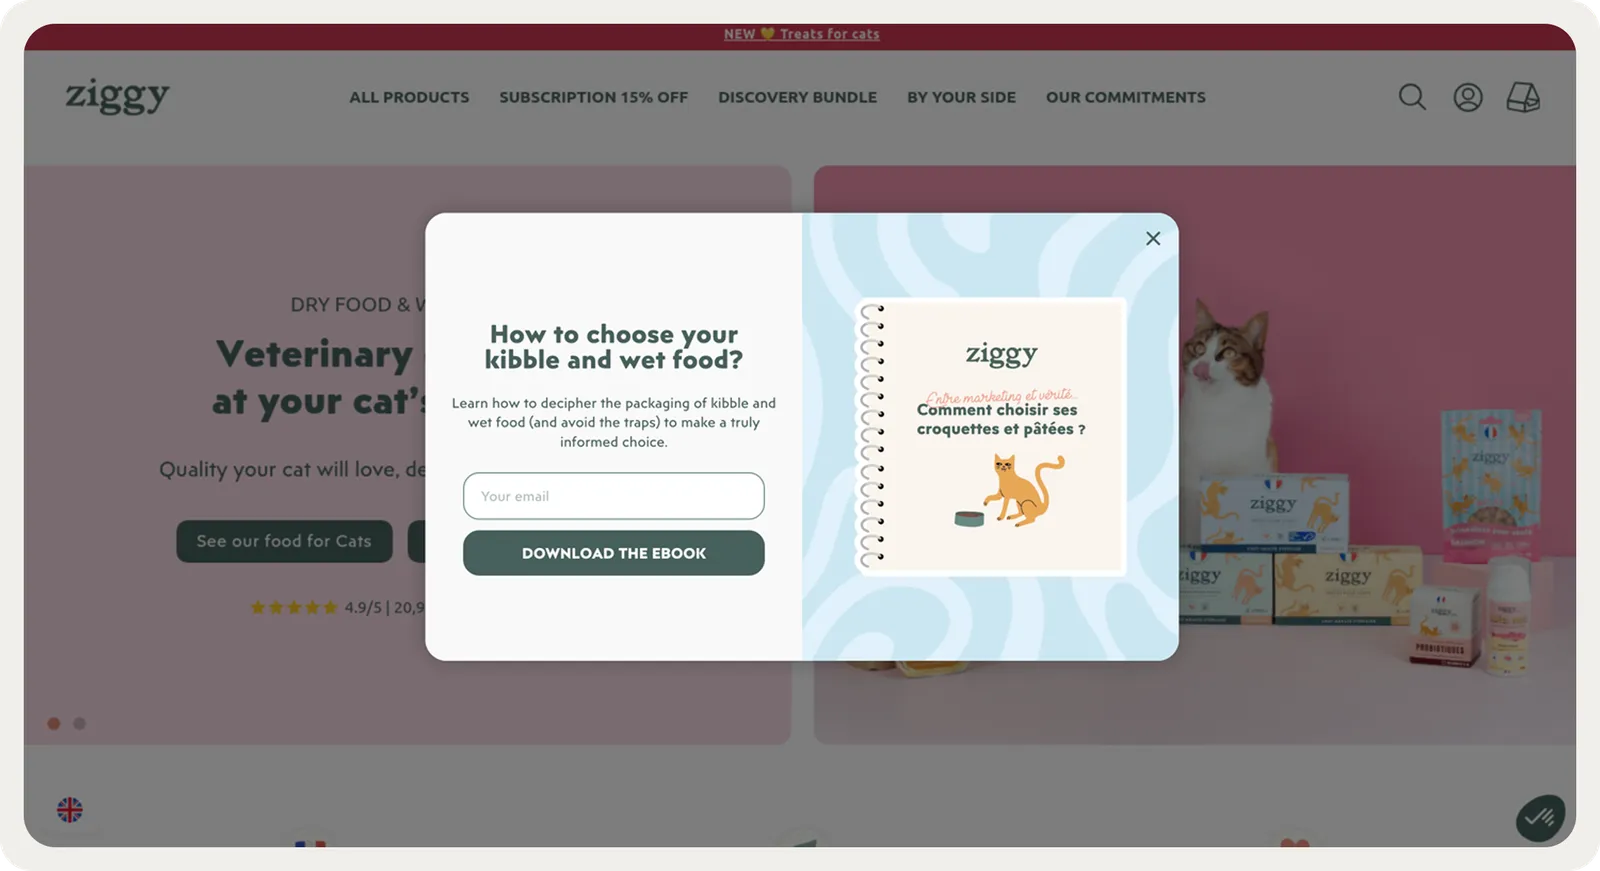
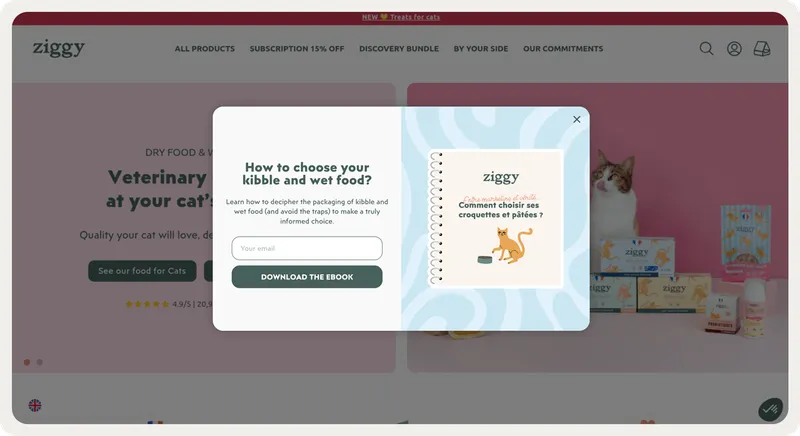
Then use campaigns to hold them. Ziggy Family, a premium cat food brand, matches the campaign to the page. Someone reading about kitten nutrition is offered an ebook on kitten nutrition, someone on a senior cat page gets one on senior cats. Those on-click ebook campaigns reached click-through rates of up to 74.9%.
Ziggy Family also added a ration calculator to help owners size portions, which became their highest-engaging campaign at 22.7%.
10. Show lead generation campaigns at the right moment
When a signup form or offer appears can matter as much as what it says. Ecommerce popups shown too early interrupt visitors who have seen nothing yet, and shown too late they miss visitors who already left.
The trigger decides that moment. In our 2026 popup study, average conversion rates ranged from 3.94% to 54.42% depending on the trigger:
Conversion rate by trigger
Campaigns visitors open themselves convert best
Average signup conversion rate for each trigger type.
Source: Wisepops popup benchmark 2026, based on 1 billion popup displays.
Each trigger fits a different situation:
On click (54.42%). The campaign opens when a visitor clicks a button or link, such as “Get 10% off”, so it meets interest the visitor already declared. Read more about the on-click popup.
AI-powered (15.98%). The campaign appears when session behavior signals intent, such as hesitation on the cart page, instead of after a fixed rule.
Hover (13.05%). The campaign responds to a visitor pausing over an element, such as a product image or a menu item.
Custom event (10.35%). The campaign reacts to an action on the site, such as adding a product to the cart or reaching a cart value.
On scroll (5.37%). The campaign appears after a set share of the page, which suits blog posts and long product pages where scroll depth signals reading.
On page load (4.72%) and exit intent (3.94%). These reach the most visitors and convert the fewest. Exit intent catches people who were leaving anyway, so its signups come on top of everything else.
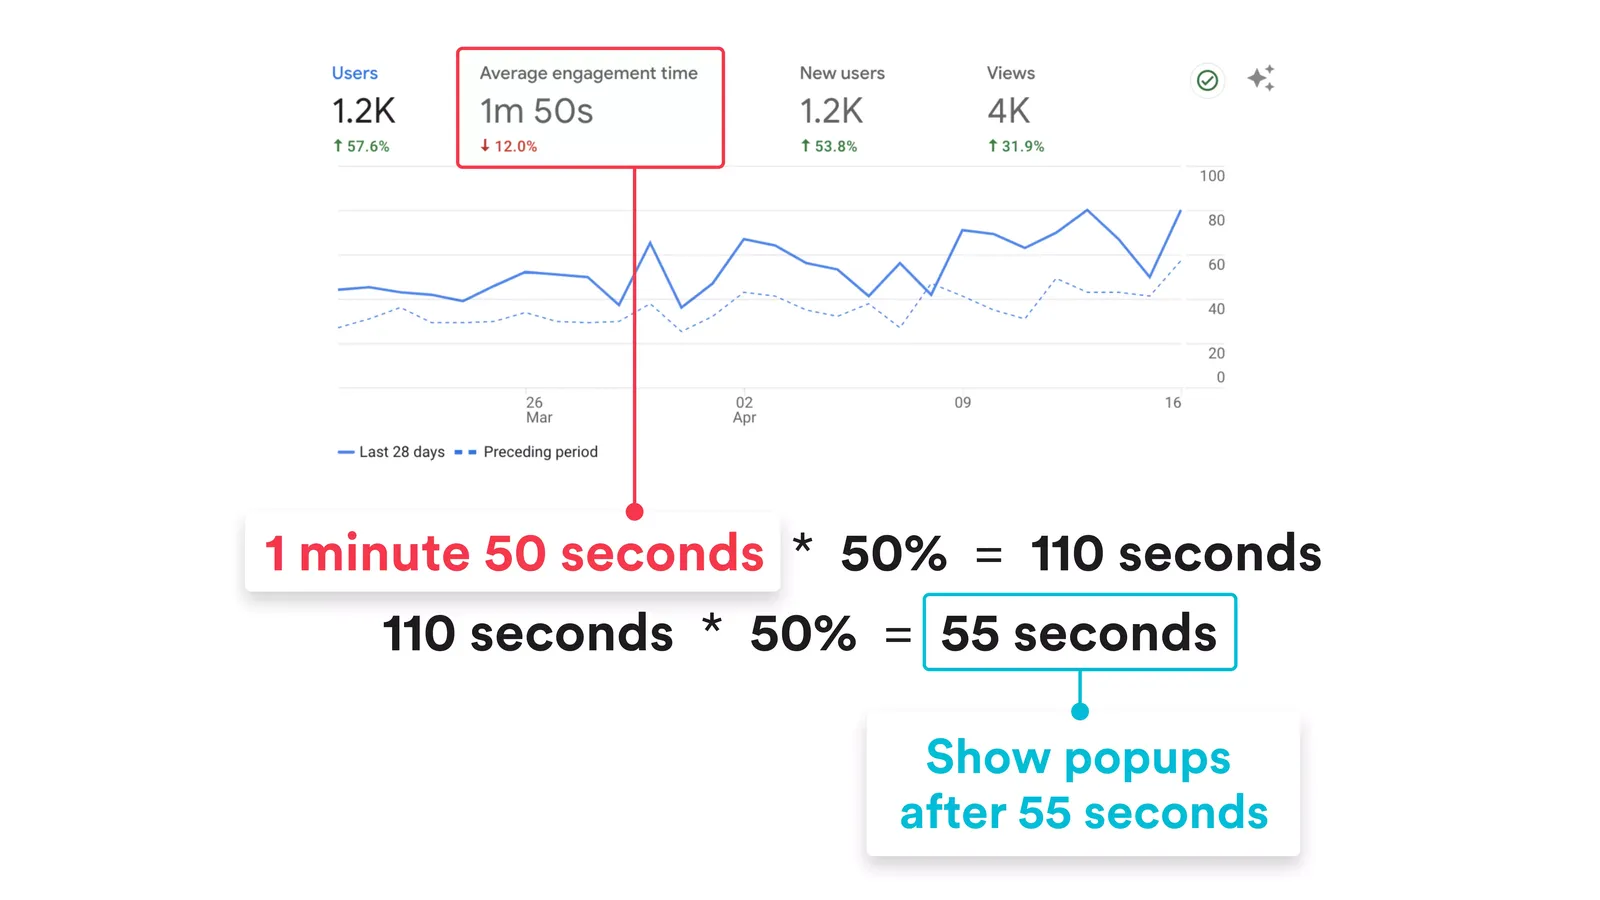
For timed campaigns, a delay of about half your average engagement time is a reasonable starting point:
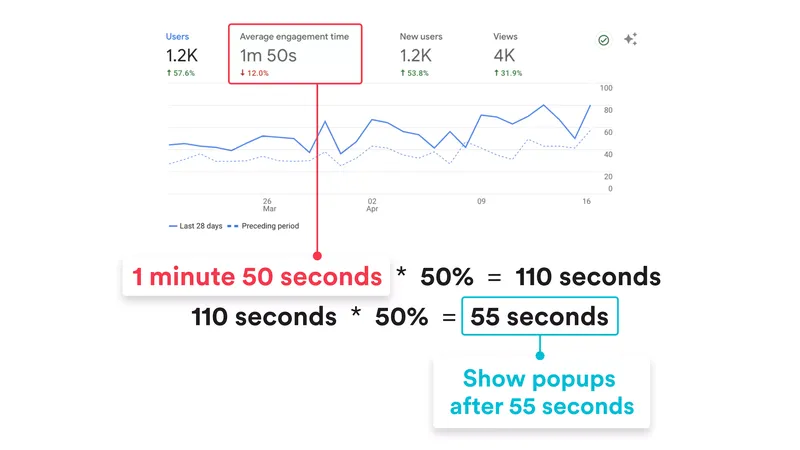
11. Recommend products based on visitor behavior
Product recommendations help visitors who are interested but haven't found the right item yet. They cut the browsing effort, which matters most on catalogs with hundreds of products.
Rule-based recommendations follow fixed logic: someone views a jacket, so you show them a scarf. AI recommendations learn from browsing and purchase patterns across all visitors, so they can suggest products to someone who has never logged in.
Each recommendation type fits a different page and visitor:
Recommendation type
Where it fits
Frequently bought together
Product page and cart, to raise average order value
Similar products
Product page, for visitors comparing options
Recently viewed
Homepage and category pages, for returning visitors
Best sellers or trending
Homepage and empty search results, for first-time visitors
Personalized picks
Cart, exit and post-purchase, based on what each visitor browsed
A few setup choices affect whether recommendations get clicked:
Start with the simple types. Best sellers and recently viewed work from day one, before a model has much browsing data to learn from.
Keep the selection short. Four to eight products are easier to compare than a long carousel.
Leave out what visitors can't buy. Filter out-of-stock items and products already in the cart.
Measure recommendations by what they sell. Track the click rate, the share of clicks that turn into orders, and the average order value of orders that include a recommended product.
As a reference point, 11.4% of clicks on recently viewed recommendations turned into orders at émoi émoi, a baby and gift brand.
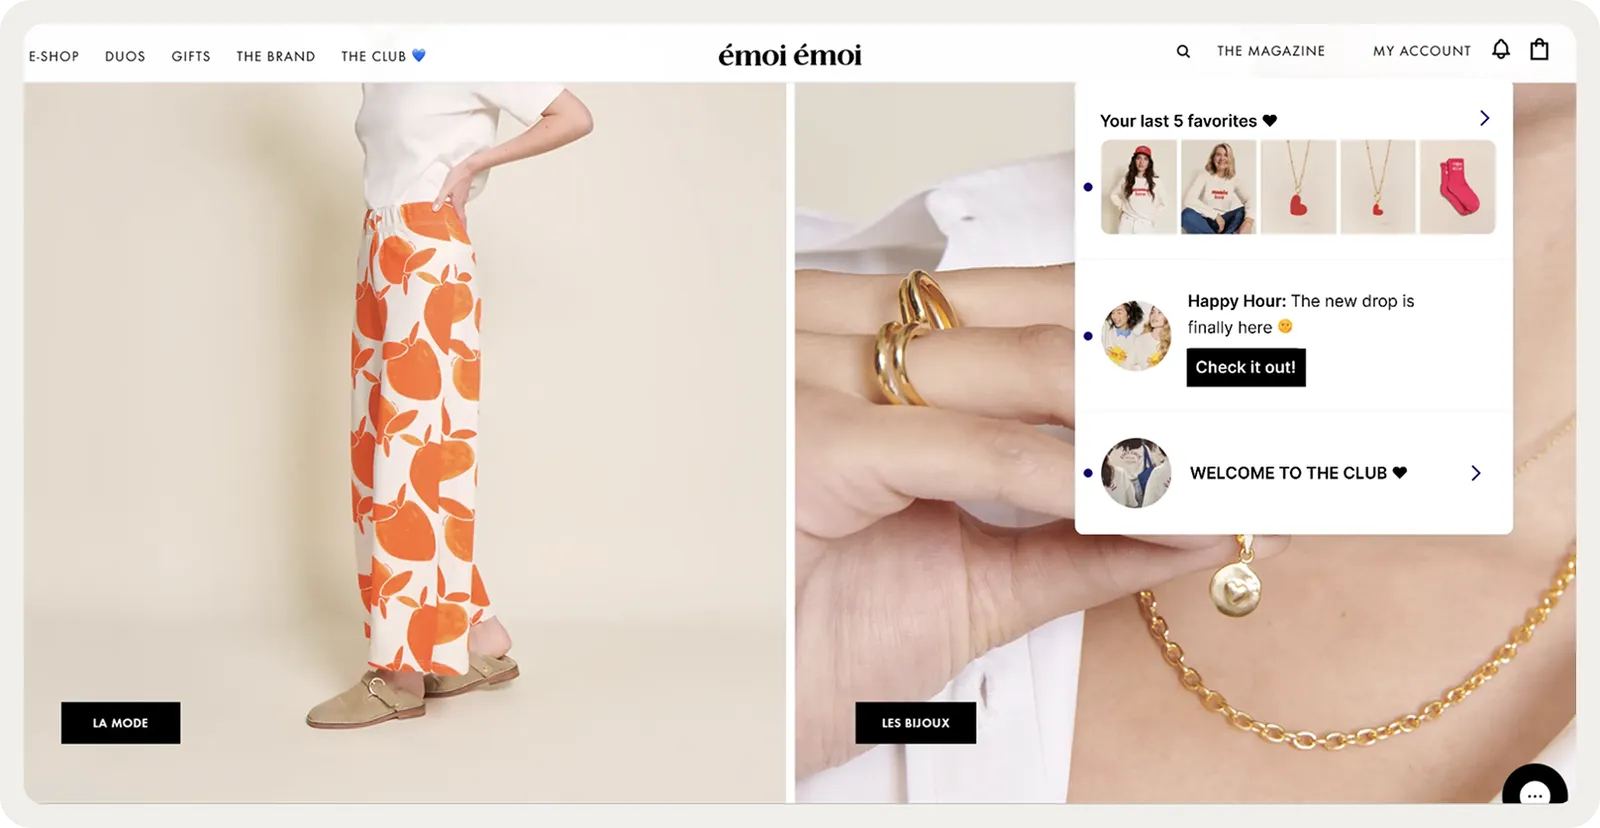

12. Retarget visitors who leave without buying
A visitor who leaves without buying can still come back. Retargeting reaches them again, either on other sites and channels or on your own site during a later visit.
The channel you can use depends on what you know about the visitor:
Channel
What it needs
Who it reaches
Retargeting ads
An ad platform pixel and an ad budget
Visitors browsing other sites and social media
Browse and cart abandonment emails
An email address
Subscribers and past customers
SMS reminders
A phone number with marketing consent
Subscribers who opted in to texts
Onsite reminders
Nothing extra, they show on the next visit
Returning visitors, including anonymous ones
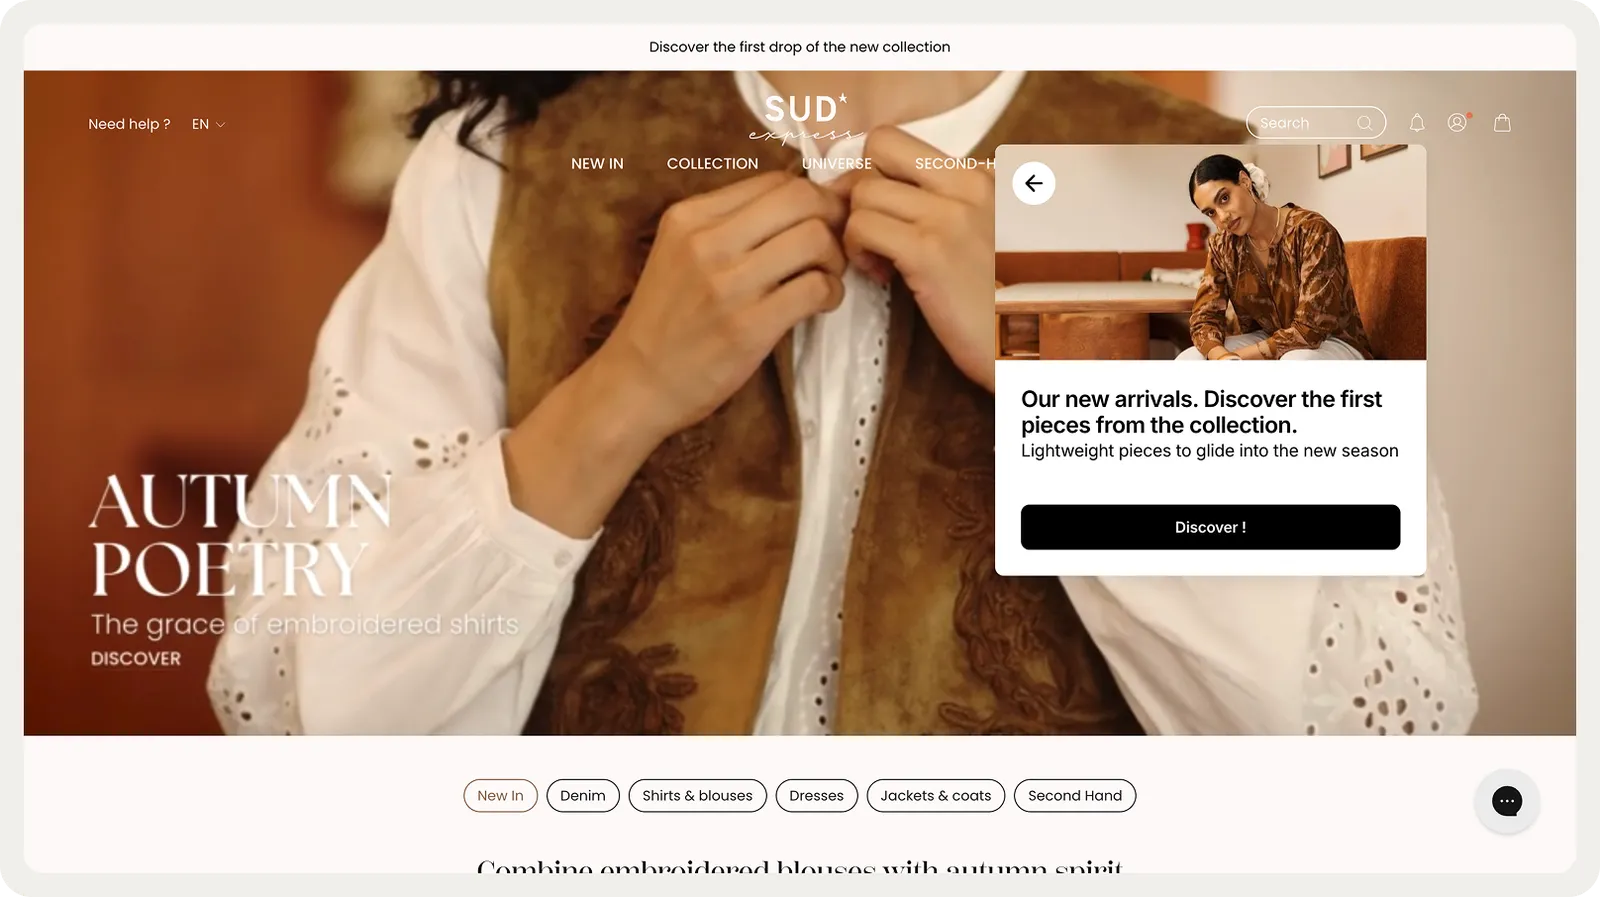
Onsite reminders cost nothing per contact, since they only appear to people already back on your site. A returning visitor can see the products they viewed last time on the homepage, in a corner panel or next to the search bar.
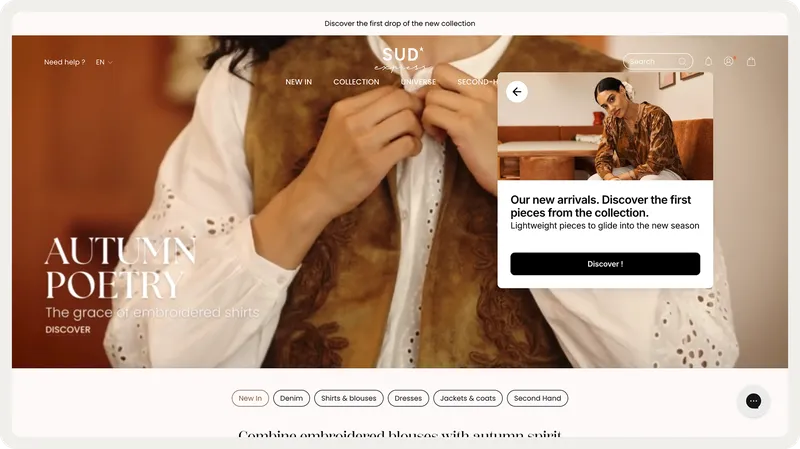
Sud Express, a fashion brand with hundreds of products, reminds returning shoppers of the items they viewed before. Those reminders get a 14.2% click-through rate.
To create an effective retargeting campaign:
Segment your audience. Categorize visitors by what they did on your site, such as the pages they visited or the products they viewed, so each group gets a message that fits.
Personalize the offer. Show people the products or services they already looked at. This level of ecommerce personalization is what separates a reminder from an interruption.
Give them a reason to come back. An exclusive offer or discount works, whether that's 10% off a first purchase or free shipping over a threshold.
Cap the frequency. Seeing the same ad or email too often wears out goodwill, so set a limit per visitor and stop once they buy.
Email and SMS retargeting only reach visitors who left a contact. The more emails you collect on your site, the more people you can follow up with later.
13. Recover carts before visitors abandon them
Cart abandonment is a common issue for ecommerce websites, with potential customers leaving before completing their purchases. Exit-intent popups recover some of those sales by showing a message or offer just as a visitor is about to go.
Here are some CRO tips for creating effective exit-intent campaigns:
Offer a compelling incentive. A discount, free shipping or another concrete reason to finish the order.
Keep it simple. One clear call-to-action that tells visitors exactly what to do to take the offer.
Use urgency. A time-limited discount or a genuine low-stock warning works. An invented deadline doesn't survive a second visit.
Timing beats interruption, too. 4murs, the home decor retailer, uses AI to predict when a basket is about to be abandoned rather than waiting for the cursor to head for the tab bar. Their cart recovery messages earned a 24.5% click-through rate against a control group.


It's also worth testing different messaging. Experiment with copy, design and offers to find what resonates with your audience.
Types of CRO tools, with examples
Each step above relies on tools, from measuring where visitors leave to testing the fix. These are popular CRO tools and software by type, all of which can help you increase your website conversions.
Web analytics tools
Analytics tools count visits and conversions, and show where visitors drop off between funnel steps.
Shopiens. An AI analyst from the Wisepops team that works on any website. You ask traffic questions in plain language, in its app or from Claude and other MCP clients, and it answers with the visitor journeys behind each finding. Free during beta.
Google Analytics 4. Free event-based analytics with conversion tracking, funnel explorations and segments by device, source and audience.
Matomo. Privacy-focused analytics you can host yourself, with goals, funnels and ecommerce tracking.
Heatmap and visitor recording tools
Conversion rate optimization is impossible without monitoring visitor behavior. The tools listed below provide insights into actions of your customers, allowing you to optimize your website and improve the overall user experience.
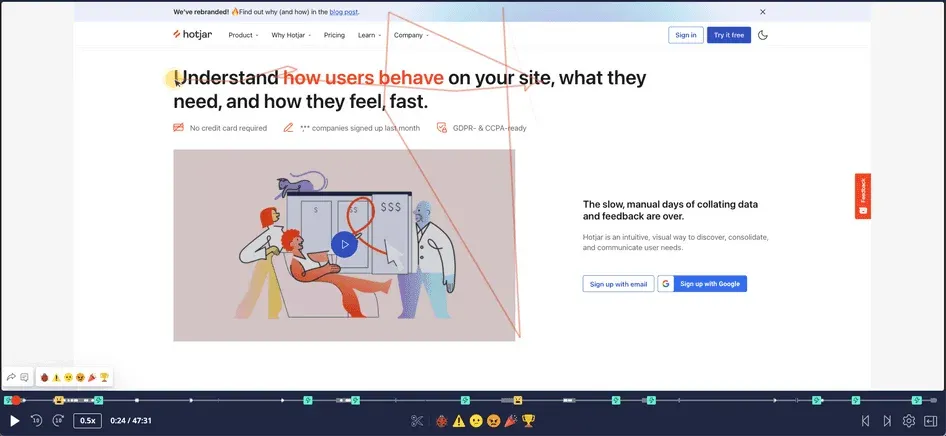
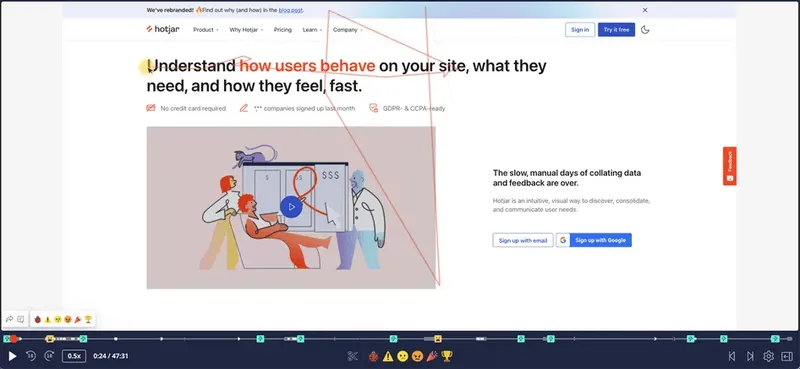
Hotjar. A popular tool that combines heatmaps, visitor recordings, conversion funnels, and surveys to give you a comprehensive understanding of user behavior.
Crazy Egg. A tool that offers heatmaps, scroll maps, and A/B testing to help you analyze visitor interactions and optimize your website accordingly.
FullStory. A platform that captures user session recordings, heatmaps, and provides detailed analytics, enabling you to identify issues and opportunities for optimization.
A/B testing tools
Testing tools split your traffic between versions of a page and report which version converts better, with statistical significance.
Optimizely. An experimentation platform for A/B and multivariate tests on websites and apps, aimed at larger teams.
Wingify. The merged platform of VWO and AB Tasty, combining A/B testing, behavior analytics and personalization.
Shoplift. A Shopify-native A/B testing app for product pages, templates and themes, run from the theme editor.
Landing page builders
These online apps make it easy to create, test, and optimize landing pages to increase conversions and generate leads.
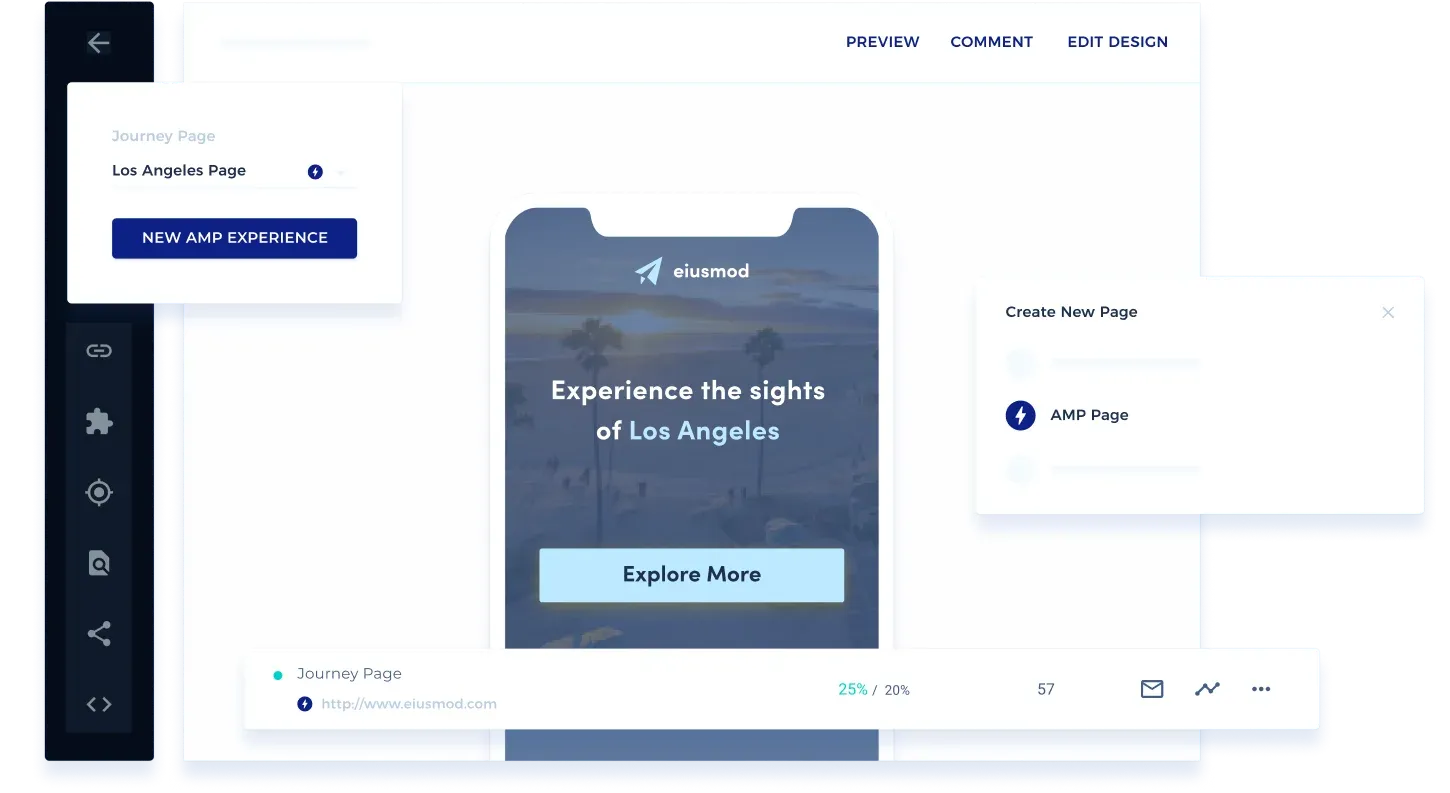
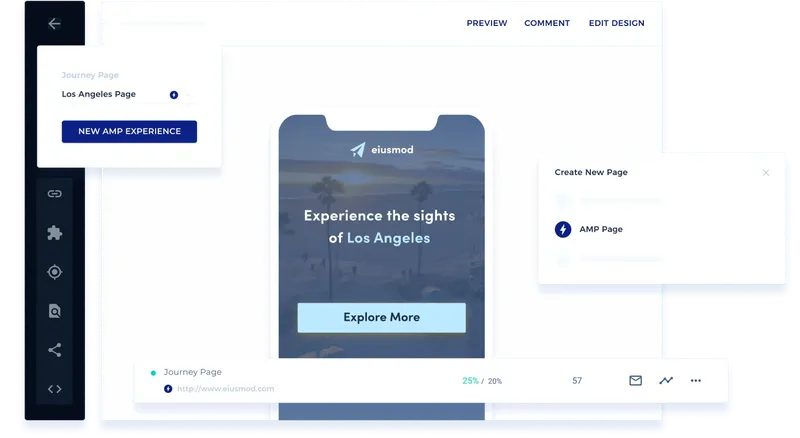
Instapage. A platform designed to help you create all elements of high-converting landing pages with ease, using its built-in templates, A/B testing, and analytics.
Unbounce. A drag-and-drop landing page builder that lets you design and test responsive landing pages without the need for any coding knowledge.
Leadpages. A user-friendly landing page builder offering a vast selection of templates, integrations, and optimization tools for driving conversions.
Traffic activation platforms
These platforms work on the traffic you already have, turning browsing behavior into engagement, leads and orders.
Wisepops. An AI-driven traffic activation platform. Wisepops runs messages across popups, sticky bars, embeds, an onsite feed and web push to increase leads, reduce cart abandonment, guide shoppers to the right products with AI recommendations, and promote offers without touching your site design.
Nosto. A commerce experience platform covering AI recommendations, merchandising and onsite search. See Wisepops vs Nosto.
Rebuy. Shopify-native personalization focused on recommendations, upsells and the checkout. See Rebuy alternatives.
Email marketing and automation tools
Email marketing tools help you segment your audience, create targeted campaigns, and automate email sequences to improve engagement and drive conversions.
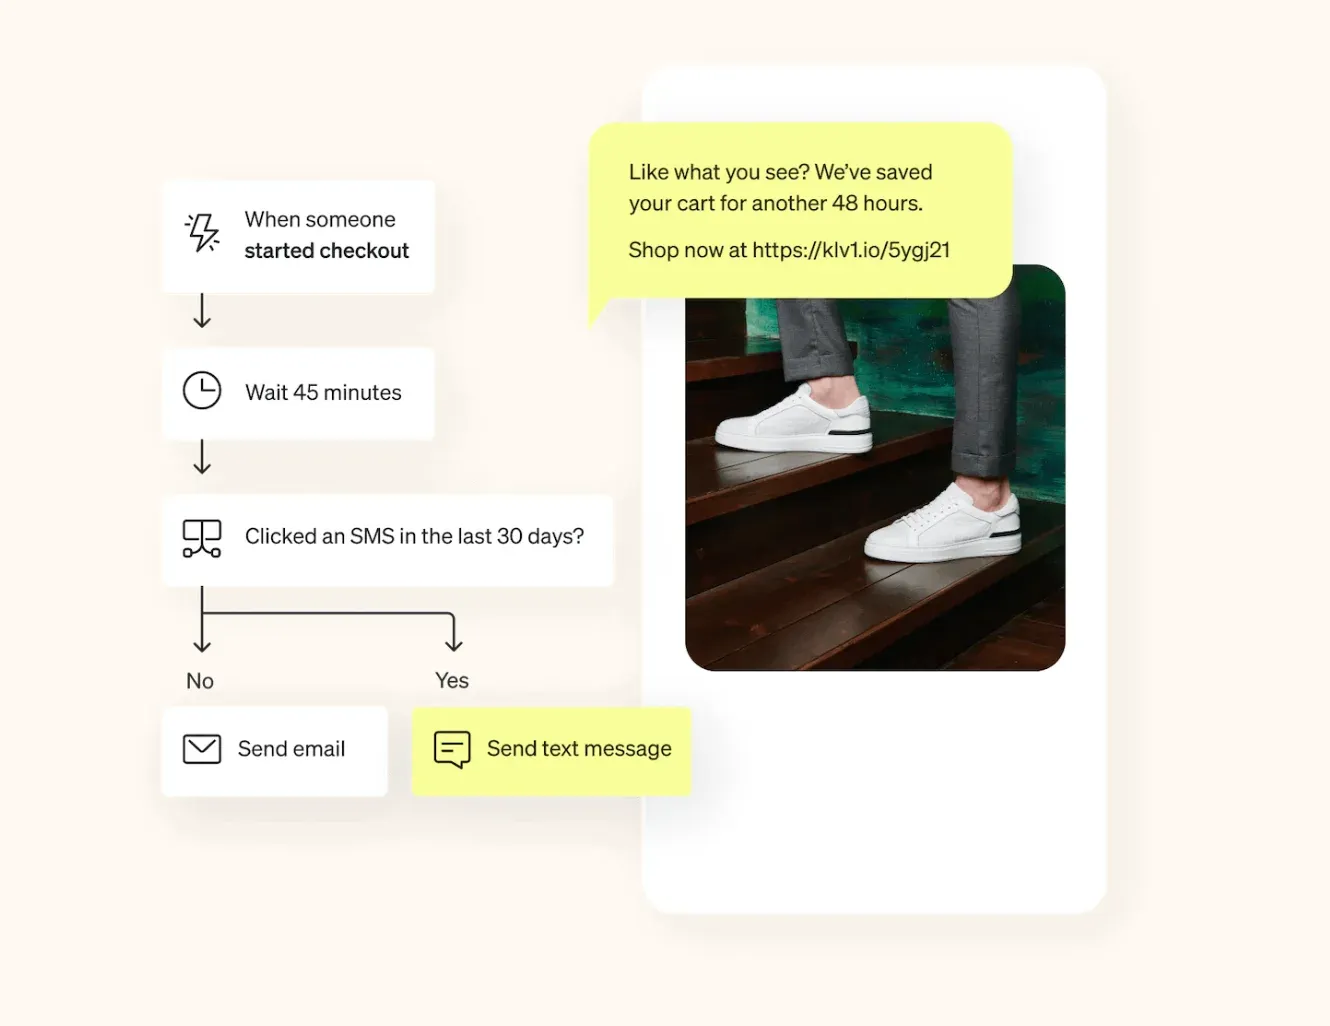
Klaviyo. An email marketing platform built for ecommerce businesses, offering advanced segmentation, automation, and integrations with popular ecommerce platforms.
Mailchimp. A popular email marketing platform that lets you create and automate email campaigns, segment your audience, and analyze the performance of your campaigns.
HubSpot. An all-in-one marketing, sales, and customer service platform that includes an email marketing and automation toolset to help you nurture leads and convert them into customers.
By incorporating these tools into your CRO strategy, you can systematically optimize your website, enhance user experience, and ultimately boost your sales and revenue.
Find more options:
Conversion rate optimization FAQ
What is the difference between CRO and SEO?
SEO brings traffic to your website. CRO turns that traffic into leads or customers. The two work together, but as new traffic gets harder and more expensive to acquire, activating the audience you already have is where the growth is.
How do you improve conversion rates on mobile?
Start by splitting your conversion rate by device, since mobile visitors often behave differently from desktop visitors. On mobile, shorter forms, wallet payments such as Apple Pay, calls-to-action within thumb reach and smaller campaign formats that leave the page visible are common fixes worth testing.
Is a 2% conversion rate good?
For an online store, 2% sits close to the global ecommerce average of about 2%. Whether it's good for your site depends on your industry, price point and traffic sources, so compare it with your own rate from previous quarters. A rising rate on stable traffic tells you more than an outside benchmark.
How long before CRO shows results?
Campaign changes show up within days. AI-driven personalization takes longer, because the models improve as they see more sessions, and results compound over 30 to 180 days. Give a CRO plan a quarter before you judge it.
Do I need a developer to run CRO?
No. With Wisepops you get a built-in drag-and-drop editor, and installation is a single tracking code, a Shopify app or Google Tag Manager. You might still want someone alongside you, and Wisepops provides strategist support to set campaigns up and improve them.
Will CRO tools slow down my website?
They shouldn't. With Wisepops, the script loads asynchronously after your own site resources finish, and campaigns only load when a trigger fires, so nothing extra downloads for visitors who never see one.
How do I know a campaign actually caused the extra revenue?
Run it against a control group that never sees it, then compare revenue between the two groups. Attribution on its own over-credits the campaign, because some of those people would have bought anyway.
Is running onsite campaigns GDPR compliant?
Yes. Wisepops cookies are strictly necessary: limited to your site, no cross-site tracking, no third-party access, so they are exempt from separate cookie consent under EU rules. Signup forms still need a consent checkbox for marketing.
Get started
in minutes
Start converting more visitors today.
Get started in minutes and see results right after.